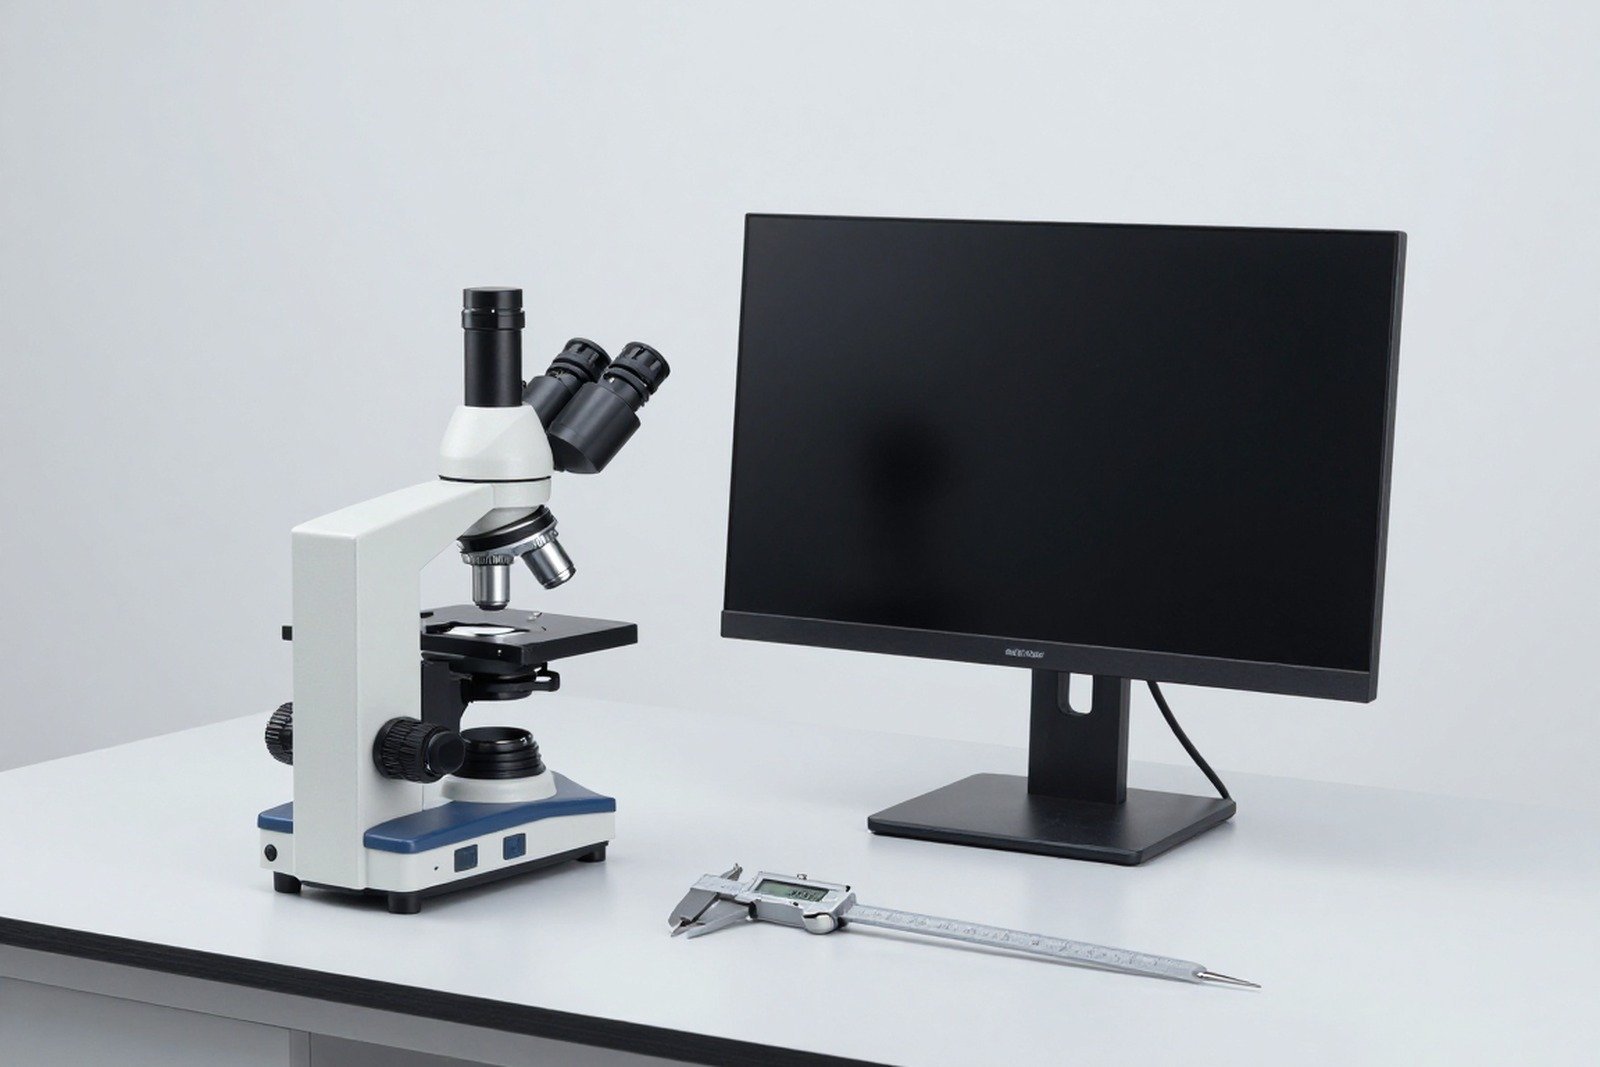
A common phenomenon in cross-section evaluation: two testing laboratories receive the same sample, measure the same criteria, but produce two different numbers. The cause often lies not in the equipment, but in the calibration method and the definition of the measuring point.
This article guides the correct procedure for measuring on cross-sectional images: calibrating the scale, defining measurement points for each criterion, handling errors, and how to record results for reproducibility.
1. Why does the same sample give three different numbers?
| Cause | How to express | Influence |
|---|---|---|
| The scale has not been calibrated properly | Deviation is proportional between measurements | Systematic error across all results |
| Use different magnifications but apply the same factor | The numbers vary by degree | Serious errors, easy to detect if compared |
| Different measurement point definitions | Small, uneven deviation | Difficult to detect, causing long debate |
| The cutting surface is beveled or not flat | Measured thickness is larger than actual | Error depends on measurement location |
| The measurer chooses the bias measurement point | Results tend to follow expectations | Measurement points should be specified in drawings |

2. Calibrate the scale before every measurement
- Use a standard slide with known graduations to establish the relationship between the actual distance and the number of pixels or divisions.
- Perform separate calibration for each objective and for each magnification level to be used.
- Check again during the shift or before each important sample set, not just on a long periodic schedule.
- Record the calibration results with device code, date, and person performing it.
One point that is easy to miss: when the imaging system changes (changing cameras, changing glass body height, changing image processing software), it must be recalibrated even if the device is not yet in maintenance period.
3. Define measurement points for each indicator
| Target | Definition of measuring point | Note against errors |
|---|---|---|
| Plating thickness in hole | Measure at many locations on the hole wall: near the hole mouth, middle of the wall and near the bottom | Specify whether to take the minimum value or the average value |
| Surface coating thickness | Measure perpendicular to the surface, in a flat area, avoiding transition areas | Avoid measuring at beveled edges where the coating is unusually thin |
| Contact ring around hole | Measure the smallest distance from the hole wall to the edge of the pad | Measure at the smallest position, not at the widest position |
| Tin absorption on component pins | Measure the height of the tin on the pin compared to the total thickness of the solder joint | Clearly determine the landmark from the component foot or from the pad |
| Thickness of intermetallic compound (IMC) layer | Measure in the middle of the interface, measure multiple times and average | Avoid measuring in areas with corners or impurities |
| void size | Measure the largest diameter and estimate the area | Specify how to determine the void boundary |
The most effective way: accompany the report with a drawing or photo with the location and direction of measurement marked. When both sides look at the same image, arguing about numbers will be much shorter.
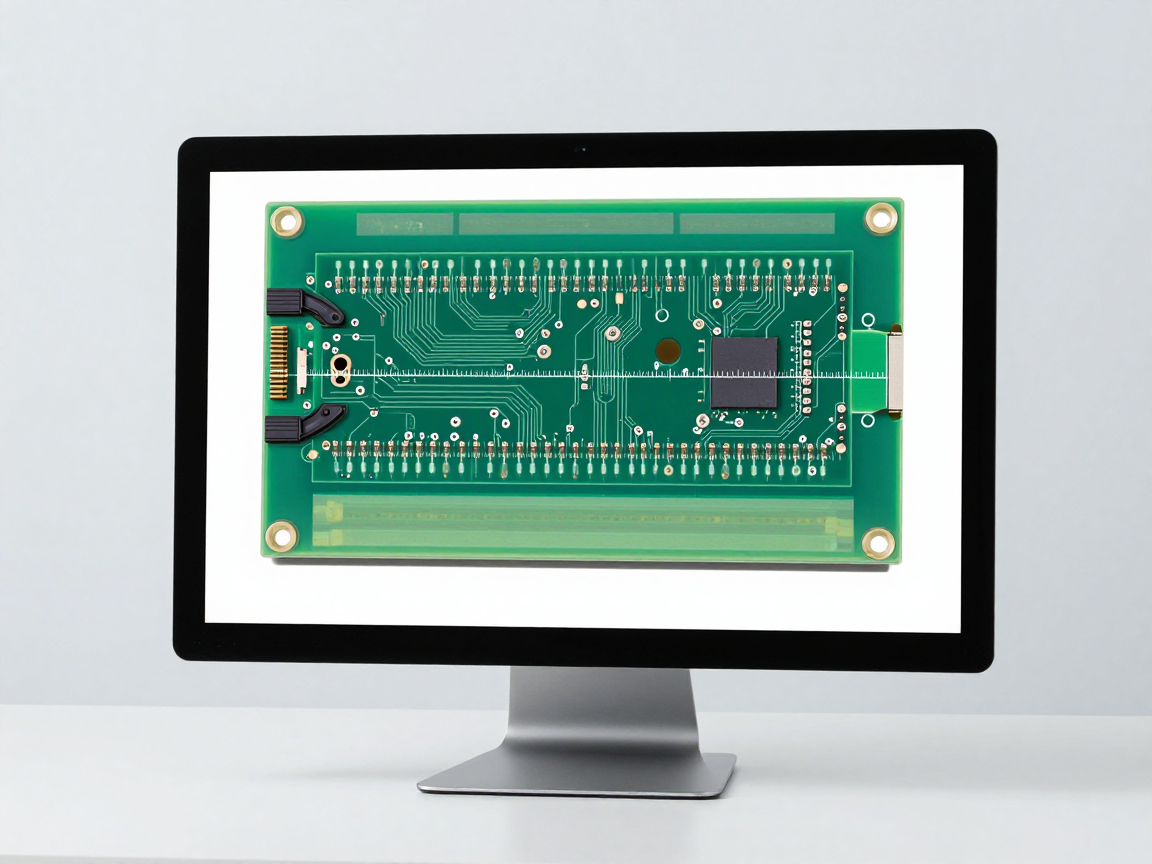
4. Error handling: three sources need to be separated
| Source of error | Characteristics | How to handle |
|---|---|---|
| Systematic error | Deflect evenly, in the same direction at every measurement | Recalibrate; Compare with standard sample |
| Random error | Fluctuates around the average value | Measure multiple times, average and record dispersion |
| Error due to sample preparation | Deviation according to position on the section | Measure in a flat area, check the sample again before measuring |
Practical rule: each number included in the report should have context — number of measurements, minimum and maximum values, magnification. A single number without context is difficult to defend when questioned.
5. Record the results for reproducibility
- Measurements, units (micrometers or mils) and conversions if necessary.
- Magnification and equipment used.
- Measurement location on the sample, described by picture or location code.
- Standards and product classes apply for evaluation.
- Original photo with scale displayed in the frame.
- Date of measurement, person measuring and person checking again.
6. Five errors cause measurements to be unreproducible
- Scale not shown in photo.
- Measured on images that have been processed to increase contrast but do not save the original image.
- Mix units of measure between items in the same report.
- The magnification is not recorded so it cannot be checked again.
- Measured on a chamfered sample without recording the sample condition.
7. Frequently asked questions
Should results be reported in micrometers or mils?
Depends on customer conventions and applicable standards. The safest way is to clearly state the unit and include the conversion, to avoid confusion between parties.
Should it be measured automatically by software?
Automated measurements help reduce subjective errors and increase speed, but people still need to double-check boundary cases — where class boundaries are unclear.
What if the area to be measured is only a few micrometers wide?
It is necessary to increase the magnification, recalibrate the scale at that magnification level, and measure many times at many locations to have a statistical basis.
How many points should a sample measure?
There is no fixed number. The principle is enough to see the distribution — if the measurement points differ greatly, it is necessary to increase the number of points instead of averaging immediately.
What is the allowable error of measurement?
Depends on equipment, magnification and applicable standards. Should be clearly defined and recorded in internal procedures, and periodically checked using standard samples.
8. Conclusion
Variations between testing laboratories are rarely due to equipment, but are usually due to three factors: improperly calibrated scale, different measurement point definitions, and beveled or uneven samples. All three can be prevented by process.
Four things to do: calibrate the scale for each magnification before each set of samples; Specify measurement points with drawings instead of words; Record the number of measurements and dispersion next to the average value; and always save the original image with the scale.
References
- IPC-TM-650 Method 2.1.1 — Microsectioning, section measurement and evaluation.
- IPC-A-600 and IPC-6012 — Criteria and technical requirements related to plating thickness and contact rings.
- IPC-7095 — Void Evaluation for BGA.
- Requirements for calibration and control of measuring equipment in the testing room quality management system.
Related articles
- Cross Section in Automotive and Medical Devices: How the Requirements Differ
- J-STD-001 and IPC-A-610: evaluation of solder joints through cross-section
- 5 strange marks on the cross-section: distinguish real errors from phenomena due to sample preparation
- From cross-sectional image to root cause: 5 investigation steps
- Peeling of coating and loss of veins: read traces on cut surface
- LED cross-section and power module: intermetallic compound (IMC) layer and solder crack
- Cross-section small chip components 0201/0402: tombstone, insufficient solder and solder bridge
- Cross-section solder joint: wetting angle, fillet penetration and intermetallic compound (IMC) layer
- From rough samples to cross-section images: casting, grinding, polishing and etching
- IPC-A-600 and IPC-6012: cross-section board acceptance criteria
- 10 circuit board defects can only be detected by cross-section
- What is Cross Section? Why do we have to cut samples to evaluate solder joints and circuit boards?
Discuss further
Disclaimer
This article is an interpretive content compiled by us; not legal advice. Enterprises need to compare relevant documents/standards verbatim before applying them to specific products.
See more: Copyright Policy & Disclaimer by ticforall.com.