Home Blog Page 9

10 RoHS restricted substances: how do the 0.1% and 0.01% limits apply to “homogeneous materials”?

0
Cover image of the article «10 RoHS restricted substances: how do the 0.1% and 0.01% limits apply to "homogeneous materials"?»

RoHS limited 10 substances. But the question that takes businesses the most time is not “how much is the limit” but rather “calculated on what”. RoHS answer is: calculated above homogeneous material — not on the whole product.

This article goes through each substance: the limit, how to convert, where the limit is most likely to be exceeded, and common misconceptions that cause test results to be misinterpreted.

1. Table of 10 restricted substances

# Quality CAS Maximum limit Common place
1 Lead (Pb) 7439-92-1 0.1 % Welds, brass alloys, easily machined steel, stable PVC, glass, ceramic of components
2 Mercury (Hg) 7439-97-6 0.1 % Tilt switches, relays, fluorescent lights (now rarely seen)
3 Cadmium (Cd) 7440-43-9 0.01 % Electroplating layer, contacts, brass alloy, old battery
4 Hexavalent chromium — Cr(VI) 18540-29-9 (ion) 0.1 % Chromium passivation layer on galvanized steel parts, paint, and ink
5 Polybrominated biphenyls (PBB) Substance group 0.1 % Brominated flame retardants in plastics (mostly eliminated)
6 Polybrominated diphenyl ethers (PBDE) 1163-19-5 (decaBDE) 0.1 % Brominated flame retardants; Focusing on recycled plastic ABS/HIPS
7 DEHP — bis(2-ethylhexyl) phthalate 117-81-7 0.1 % PVC cable, soft plastic cover, glue, printing ink
8 BBP — benzyl butyl phthalate 85-68-7 0.1 % Soft PVC plastic, glue, ink
9 DBP — dibutyl phthalate 84-74-2 0.1 % Glue, printing ink, plasticizer in PVC
10 DIBP — diisobutyl phthalate 84-69-5 0.1 % DBP’s “brother” plasticizer, often included in the same material

One exception to remember: cadmium has a limit 0.01 % — exactly 10 times tighter than the other substances. This is the reason why cadmium is the substance that causes the most “dead” shipments in the plating and alloy industry.

Glass sample vials sit on a shelf in the chemistry lab next to pipettes
Ten substances, three different limits: 0.1 % for nine substances and 0.01 % for cadmium — calculated on homogeneous material.

2. The limit is calculated on “homogeneous materials”, not on products

This is the easiest point to misunderstand. RoHS no requires “the average of the whole product is less than 0.1%”. It requires: all materials are homogeneous Product components must all be below the limit.

Direct consequence: can a product weighing 2 kg meet RoHS despite containing a 5 g screw that exceeds the limit? No. Just one homogenous material exceeds the limit, the product has failed — no matter how small the volume of material.

How to calculate Results True or false according to RoHS
Average across all products Can output 0.02 % → “pass” Wrong — RoHS does not use this method
On each material uniformly Plating layer has 0.08% Cd → “failed” Yes — this is how RoHS regulates it

Therefore, the disassembly step (disassemble to a homogeneous material) determines the correctness of the entire result. If the disassembly is wrong — for example, taking the entire connection port assembly together — then even if the test room does it very accurately, the results will still be legally meaningless.

3. Convert between %, ppm and mg/kg

The three ways to write below are same value:

Threshold Write in % Write in ppm / mg/kg
The remaining nine substances 0.1 % 1,000 ppm = 1,000 mg/kg
Cadmium 0.01 % 100 ppm = 100 mg/kg

In practice, test reports are often presented in mg/kg, while contracts and declarations of conformity are often stated in %. When comparing, refer to the same units — this is a very common administrative error when reading quick reports.

4. Four phthalates: four “new” substances but have been available since 2015

PBB and PBDE are the six parent substances since 2003. Four phthalates (DEHP, BBP, DBP, DIBP) are added by Directive (EU) 2015/863, with application roadmap by product group:

Product group Time to start applying
Common electrical and electronic equipment July 22, 2019 (some groups), July 22, 2021 (mostly)
Medical equipment, monitoring and control equipment July 22, 2021
In vitro diagnostic medical equipment July 22, 2024

Of these four substances, DIBP has one practical characteristic: it is common Comes with DBP in the same PVC material. So if the DBP is reported to be close to the limit, check the DIBP of the same material — this is a common trap when screening just one substance.

5. What happens if the limit is exceeded?

Situation Consequences
A homogeneous material exceeds the limit, with no exemption The product is not placed on the EU market — does not have a valid CE marking
Exceeded the limit but There are exemptions Correct item and on time Allowed — but must be documented in technical records and declaration of conformity
Discovered after sale Must handle: recall, notify supervisory agency — costs are often much greater than the cost of redesigning from scratch

Important points: Exceeding the limit is not automatically a violation. A violation is “exceeding the limit and not subject to exemption”. So the first question when seeing a red result is not “how to replace the material” but “is this material included in any exemptions?”
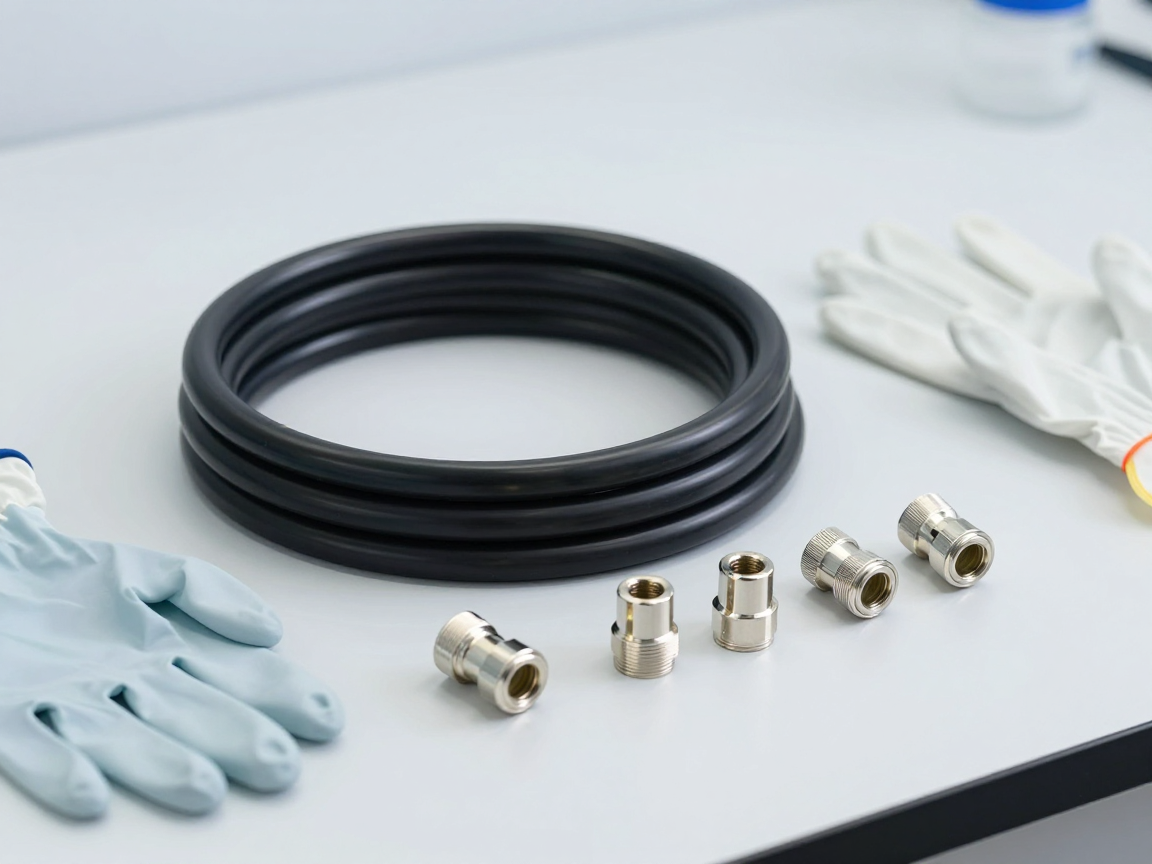
PVC cable reel and plated metal parts placed on the test table
PVC cables and metal coatings are the two most common exceedances: phthalates on one side, cadmium and Cr(VI) on the other.

6. Actual hot spots for each substance group

  • Lead: welds (also used in high temperature welds), brass alloys in valves/connecting pipes, free-machining steel, PVC for stabilization. Most cases still rely on exemptions — and exemptions are what are renewing in 2026–2027.
  • Cadmium: electroplating, electrical contacts, low-temperature solder alloys, doped brass. It is very difficult to handle because the 0.01% limit is close to the background level of many materials.
  • Cr(VI): chromium passivation layer on galvanized steel parts. XRF equipment that reports “Cr” only indicates total chromium, Cannot distinguish Cr(III) and Cr(VI) — the above-limit results from XRF are not enough to make a conclusion.
  • PBB and PBDE: focus on recycled plastic. ABS/HIPS plastic materials recycled from old equipment are where the most organic bromine residues are.
  • Four phthalates: PVC cable, soft plastic cover, glue, printing ink. In many cases, phthalates are cross-contaminated from belts, packaging, or from the conveyor belts and gloves used in production.
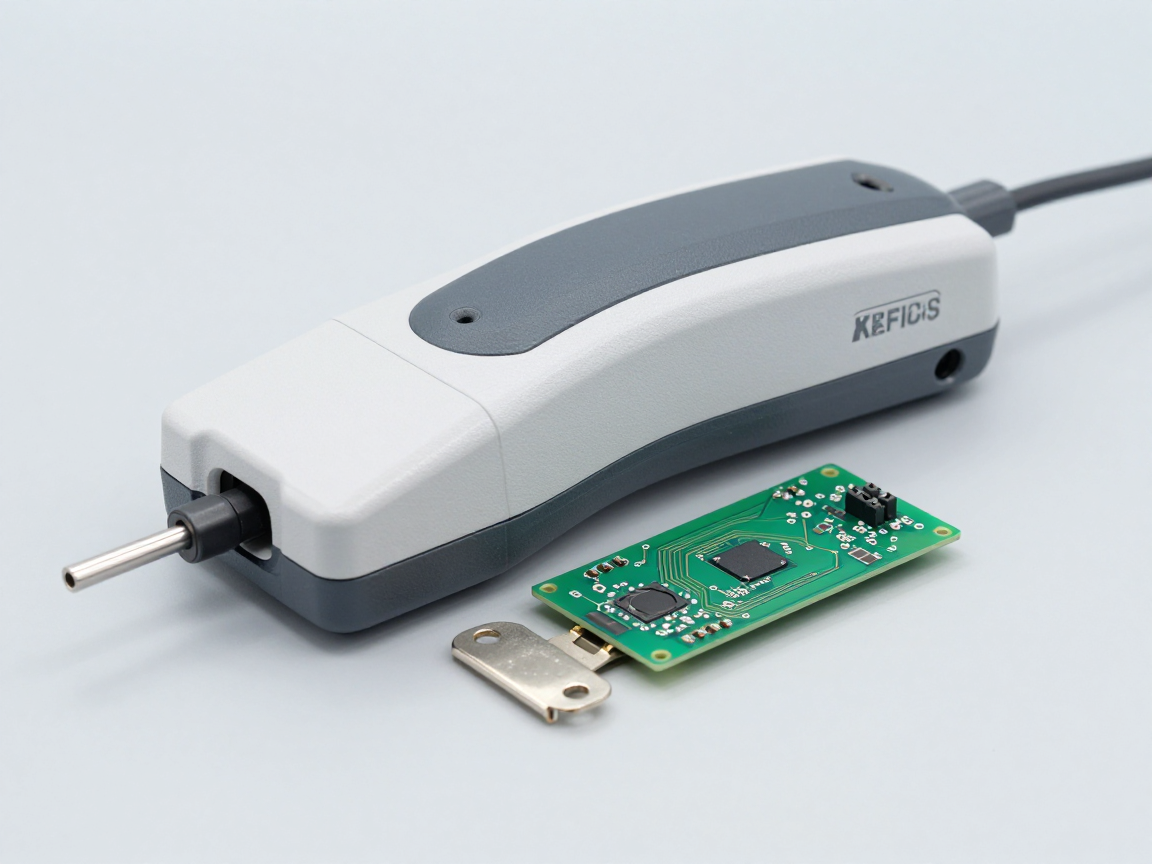
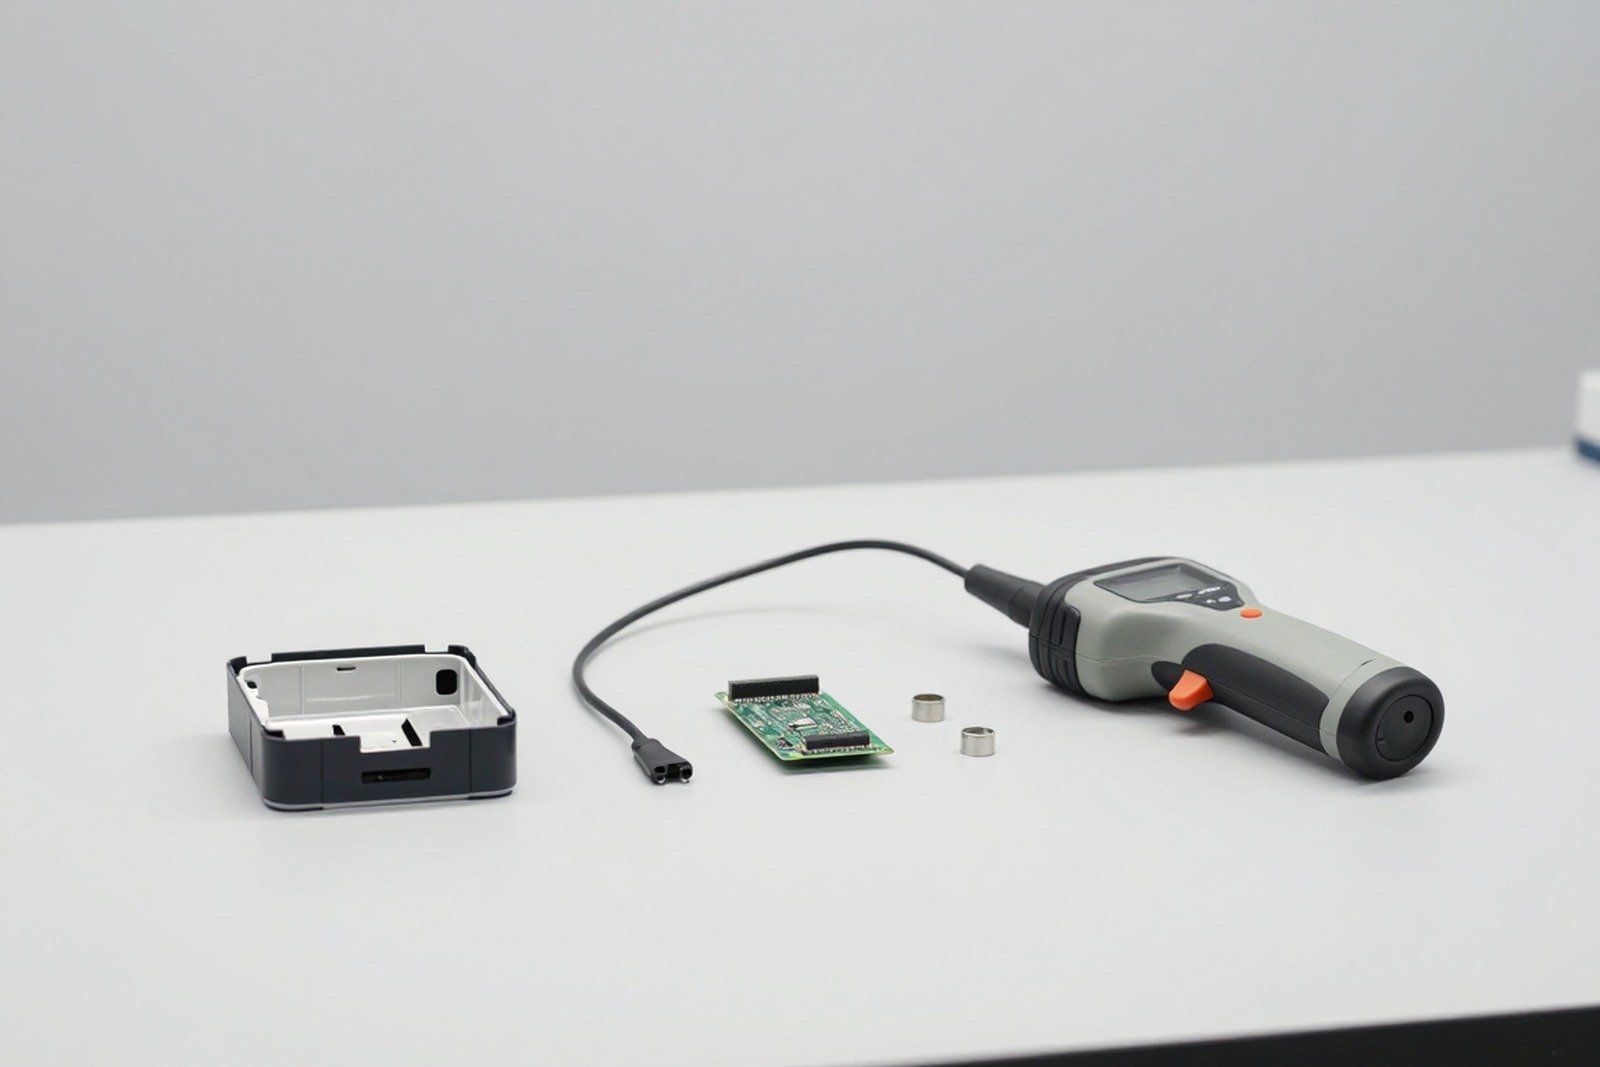
The handheld XRF device is placed on an electronic circuit board and a plated metal part
XRF only indicates the total element; With chromium, results exceeding the limit still require chemical methods to determine Cr(VI).

7. Five common misconceptions

  1. “On average, all products below the limit are satisfactory.” Incorrect — RoHS calculated based on homogeneous materials.
  2. “Small amounts of materials don’t count.” Wrong — one 3g screw exceeding the limit is enough to fail the product.
  3. “XRF pass is definitely pass.” Not really — XRF is a screening method; Inconclusive results require chemical testing, and XRF does not distinguish between chemotherapy types.
  4. “Exceeding the limit is a violation.” Not necessarily — if the exemption is on time and in the right section, it is valid.
  5. “RoHS only applies to goods exported to the EU.” No longer true — China already has a mandatory standard GB 26572-2025 with a list of substances almost identical to the EU, effective from August 1, 2027.

8. Frequently asked questions

What is meant by the pressure limit for “homogeneous material”?

The smallest level that can be separated mechanically — for example, plating, paint, individual welds, each type of plastic in a multi-material part. If further separation is not possible without damaging the material, it is a homogeneous material.

Cadmium 0.01% is how many ppm?

100 ppm, equivalent to 100 mg/kg. The remaining nine substances are at the limit of 1,000 ppm (0.1 %).

In the same part there are many materials, how to take samples?

Disassemble each homogeneous material and test it separately. Do not grind together. Details of the dissection procedure will be found in our separate article on sample dissection according to IEC 62321-2.

If XRF reports a result below the limit, do we need to test further?

Usually not, if the XRF is well calibrated and the results are clearly below the limit (not close to the limit). If results are close to the limit or if the sample background is suspected to be complex, it should be confirmed by chemical methods.

Can a product that meets all 10 substances be labeled “RoHS compliant”?

Recorded in an honest and authoritative manner, but note: “RoHS compliant” is a manufacturer’s declaration, not a certification issued by an organization. Misrepresentation — for example, saying “certified” when only a test report is available — could be considered misleading.

9. Conclusion

RoHS limits 10 substances with a limit of 0.1% — only cadmium 0.01% — and Apply to each material uniformly. Three things need to be understood: right limit, right unit, right way of dissection. If one of the three is wrong, the test results — no matter how accurate the test lab is — will not protect the business from market surveillance agencies.

References

  • Directive 2011/65/EU (RoHS 2), Annex II — list of restricted substances
  • Directive (EU) 2015/863 amends Annex II, adding four phthalates
  • IEC 62321 — set of methods for the determination of substances in electrical and electronic products

Related articles


Discuss further


    Disclaimer

    This article is an interpretive content compiled by us; not legal advice. CAS numbers and limits are given for reference and should be compared with the text of Annex II of Directive 2011/65/EU (consolidated version).

    See more: Copyright Policy & Disclaimer by ticforall.com.
    What is RoHS? Complete guide to Directive 2011/65/EU and its 10 restricted substances

    0
    Cover image of the article «What is RoHS? Complete guide to Directive 2011/65/EU and its 10 restricted substances»

    If you are exporting any products with electrical or electronic components to Europe, then RoHS is a set of regulations you must comply with — not the only one, but nearly impossible to avoid. This article is a complete overview: What RoHS requires, who must do it, where to measure, what the limit is, what the records include, and the most confusing concepts.

    This is the pillar article of a series of content on RoHS testing. In-depth articles (each substance, each testing method, each market) will link back here.

    1. What is RoHS?

    RoHS stands for Restriction of Hazardous Substances — “limit the use of toxic substances”. This is the familiar name of Directive 2011/65/EU of the European Union: regulations restricting the use of certain toxic substances in Electrical and Electronic Equipment (EEE — Electrical and Electronic Equipment).

    The goal is dual: to reduce toxic substances entering the e-waste stream, and to ensure a level playing field between manufacturers and importers selling into the EU market.

    The three most important changes

    Mold Text Change
    2003 → applied from July 1, 2006 Directive 2002/95/EC (original RoHS) Limitations 6 substances: lead, mercury, cadmium, hexavalent chromium, PBB, PBDE
    2011 → applied from 2013 Instructions 2011/65/EU (RoHS 2 — rewrite) Expand the scope to 11 product groups, attach obligations CE mark and declaration of conformity, supplementing the Exemption Appendix
    2015 → applicable from 2019/2021 Directive (EU) 2015/863 Add 4 phthalates (DEHP, BBP, DBP, DIBP) → total 10 substances
    2025 Directive (EU) 2025/2456 Transfer the task of scientific and technical assessment (exemption, review of substance list). ECHA

    Note about names: in legal documents no the concept of “RoHS 1 – RoHS 2 – RoHS 3”. That’s what the market calls it. The currently effective document is Directive 2011/65/EU has been modified by 2015/863 and 2025/2456. When making the application, you should clearly state the document number instead of writing “RoHS 3”.

    2. Who is subject to compliance and which products are covered

    RoHS obligations imposed manufacturer (even if you are not the actual manufacturer but only have your name on the product), authorized representative in the EU, importer and distributor — Each party has different obligations but must both prove that the product conforms to regulations.

    The key lies in the principles “open scope”: every Products with electrical or electronic components are covered by RoHS, unless specifically excluded. In other words, the right question is not “is my product on the list?” but “is my product included in the exclusion list?”.

    11 product groups (Appendix I)

    # Group For example
    1 Large household appliances Refrigerator, washing machine, dishwasher
    2 Small household appliances Vacuum cleaner, iron, clock
    3 Information technology and telecommunications equipment Computers, phones, routers, monitors
    4 Consumer equipment TV, camera, audio equipment
    5 Lighting equipment LED lights, fluorescent lights, decorative lights
    6 Electrical and electronic tools Drills, welding machines, hand tools
    7 Toys, entertainment and sports equipment Electronic toys, children’s electric bicycles
    8 Medical equipment Blood pressure monitors, diagnostic equipment
    9 Monitoring and control tools Measuring equipment, industrial sensors, control panels
    10 Vending machine Water vending machines, ATM machines
    11 Other electrical and electronic equipment “Open” group — arrest all remaining products with electronic components, from July 22, 2019

    Groups 8 and 9 have a later roadmap: medical equipment and monitoring and control tools apply from July 22, 2019; medical equipment in vitro diagnostics and industrial monitoring and control tools applicable from July 22, 2021.

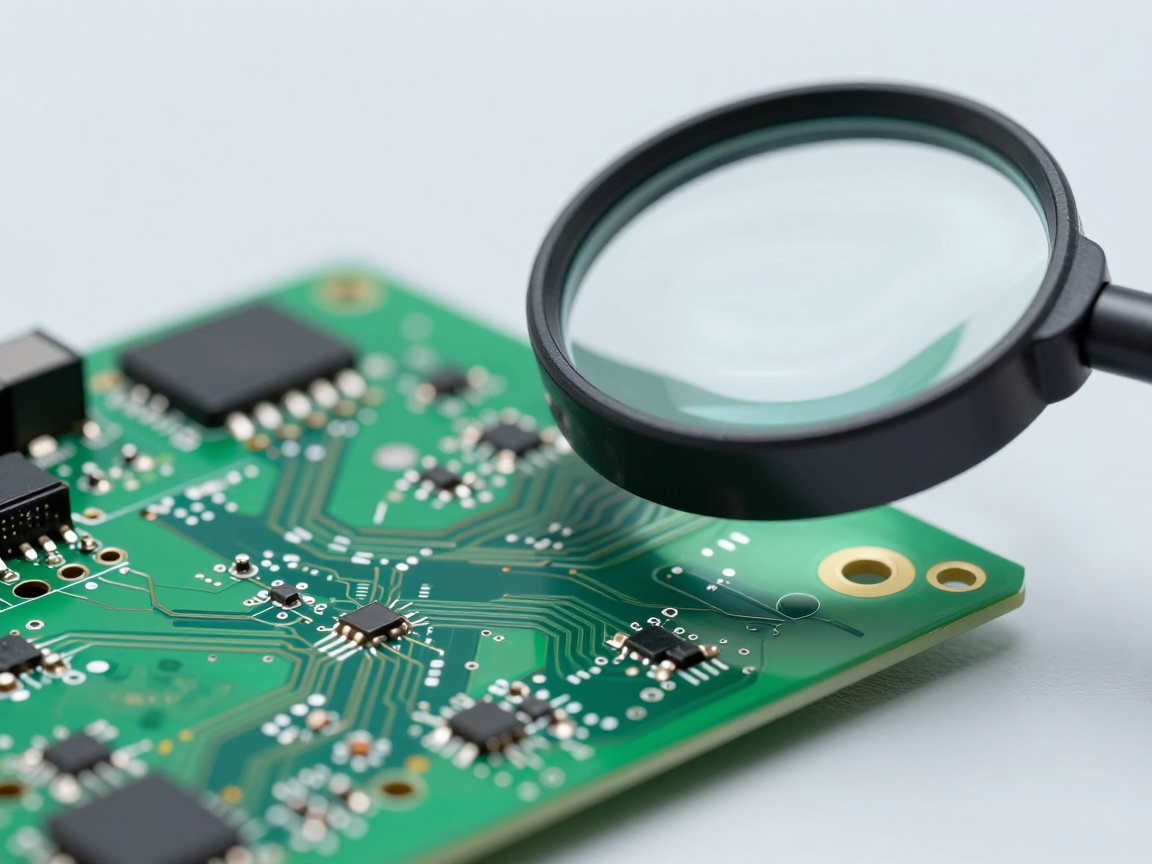
    Electronic circuit board and separate components on the laboratory table, with a magnifying glass to examine the solder joints
    RoHS applies accordingly product group and follow homogeneous material within the product — not the product as a whole.

    Excluded cases (Article 2)

    The common, conditional exclusion list includes: equipment for national defense and security; equipment designed to be sent into space; Research and development equipment is only sold between businesses; large-scale fixed industrial tools; large-scale fixed installation systems; vehicles (except electric two-wheeled vehicles); off-road mobile machinery used for professional purposes; active implantable medical devices; and solar photovoltaic panels used in fixed installation systems.

    Actual warnings: Much of the dispute over scope lies in these exclusions, since each exclusion has conditions attached. For example, “large-scale fixed industrial tools” doesn’t mean every large machine in the factory — it depends on how it’s installed and operated. Before relying on an exclusion point to not make a dossier, you should check the full text of Article 2 and consult with an accredited testing unit.

    3. Ten restricted substances and allowable limits

    This is the core part of RoHS — and it’s also the most misunderstood part. RoHS no absolutely prohibited; RoHS set limit.

    # Quality Commonly found anywhere in the product Threshold
    1 Lead (Pb) Solder joints, alloys, glass and ceramic components, plating 0.1%
    2 Mercury (Hg) Old batteries, tilt switch, some lights 0.1%
    3 Cadmium (Cd) Electrical contacts, plating, brass alloy, old rechargeable batteries 0.01%
    4 Hexavalent chromium — Cr(VI) Chrome plating and passivation layer prevent rust 0.1%
    5 PBB (polybrominated biphenyls) Flame retardants in plastic (now rare) 0.1%
    6 PBDE (polybrominated diphenyl ethers) Flame retardants in plastics, cables, and equipment covers 0.1%
    7 DEHP (bis(2-ethylhexyl) phthalate) Plasticization in PVC — cables, flexible covers, artificial leather 0.1%
    8 BBP (butyl benzyl phthalate) Plasticizer in PVC, glue, printing ink 0.1%
    9 DBP (dibutyl phthalate) Plasticizer in PVC, glue, rubber 0.1%
    10 DIBP (diisobutyl phthalate) Plasticizer in PVC, replacing DBP 0.1%

    Four phthalates (7–10) have their own application routes: from July 22, 2019 with groups 1–7 and 10; word July 22, 2021 with groups 8 and 9.

    Three points need to be engraved in the head:

    1. Cadmium has its own limit of 0.01% — 10 times tighter than the other 9 substances. This is a substance that is often overlooked when reading reports.
    2. The 0.1% limit is according to the mass of the homogeneous material, not by total product volume. A tiny detail that exceeds the limit still makes the entire product non-compliant.
    3. Cr(VI) is a valence, not a chromium element. XRF measured total chromium, cannot distinguish between Cr(VI) and Cr(III) — this is the reason why many XRF reports “exceeding the chromium limit” still require additional confirmation.

    4. Where is the limit measured? What is “homogeneous material”?

    Homogeneous materials (homogeneous material) is a material with composition mechanically identical — cannot be further separated into different materials by mechanical disassembly (unscrewing, cutting, grinding, centrifuging…).

    For example, with a cable: the PVC sheath is one homogeneous material; copper intestine is one homogeneous material; The tin plating on the copper conductor is again one homogenous material too. If the PVC sheath exceeds the phthalate limit, the entire rope is not compliant umbrella The copper conductor and plating layer are completely clean.

    Given a circuit board: FR-4 resin, each solder joint, component pin, coating, plastic surrounding the component — each is its own homogeneous material and each must be evaluated separately.

    This is why the number of measurement points in a RoHS test set is often much larger than initially envisioned, and is also why the sample extraction step determines the quality of the report.

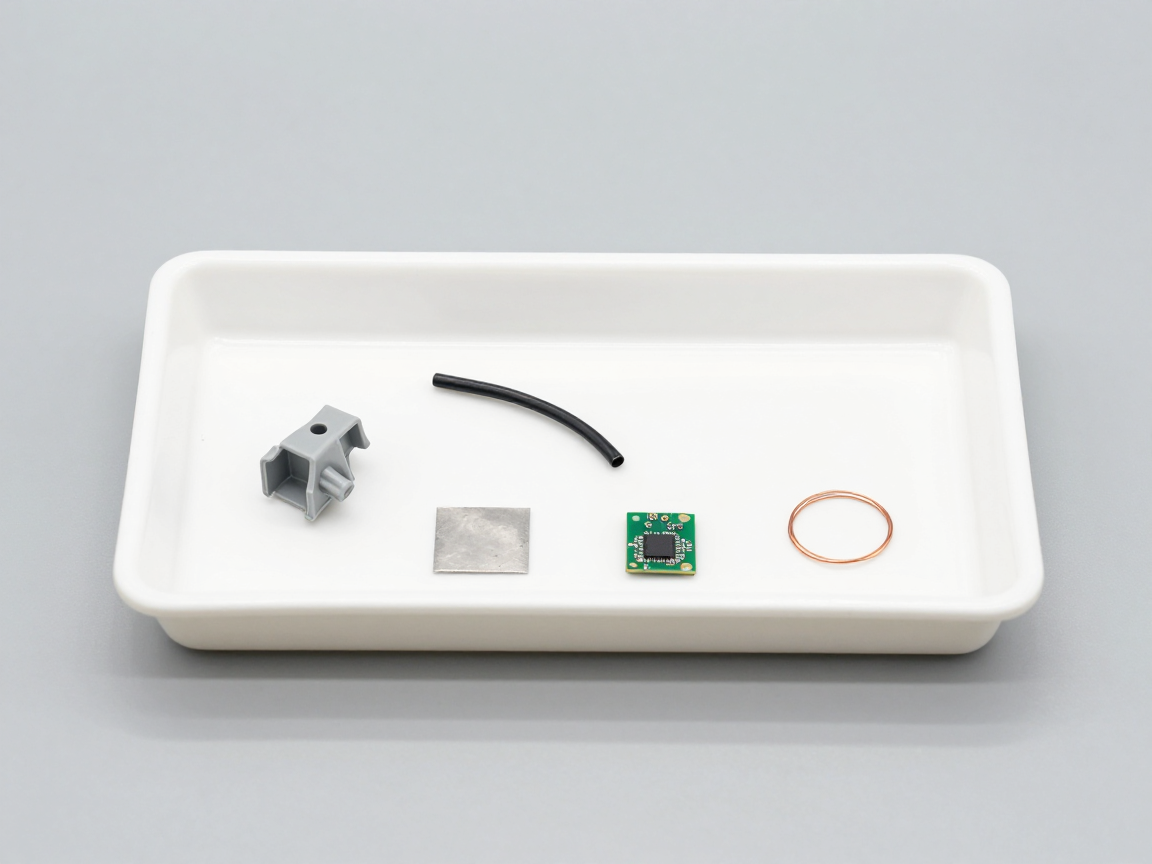
    Laboratory table with many small sample parts separated in trays: plastic shell, cables, metal foil
    An electronic product can be separated into dozens of “homogeneous materials”; RoHS limit applies each materials, does not apply to the whole product.

    5. Specific obligations: what must businesses do?

    Obligation Content Base
    Ensure the product does not exceed the limit Control input materials, evaluate components, and periodically inspect Article 4
    Technical documentation Prove compliance: material declaration, test results, risk assessment, supplier documents Article 7(b) + harmonized standards EN IEC 63000:2018
    EU Declaration of Conformity (EU DoC) The declaration, signed by the manufacturer, lists the RoHS Directive and related documents Article 7(c)
    Attach CE mark CE is a declaration that the product conforms to regulations whole Applicable laws (RoHS, EMC, LVD, WEEE… depending on product) Article 7(a)
    Save profile Keep technical documents and DoC 10 years after bringing the product to market Article 7(c)
    Cooperate with supervisory authorities Provide documents when requested, take corrective measures if found to be non-compliant Article 7(d)(e)

    Important points: RoHS does not require “certification”. The obligation of the enterprise is self warranty and self statement, based on technical records. The lab test report is one part of that record — not the entire record, and not the license.

    Printed technical documents are placed on the table next to electronic components and pens
    Technical records (not a single test report) are what businesses must save for 10 years and submit when requested.

    6. Exemption: when RoHS allows the use of a restricted substance

    Because of some applications not yet credible alternative, the Directive has a mechanism exemption — recorded in Appendix III (groups 1–7, 10, 11) and Appendix IV (groups 8, 9). Exemption yes deadline, is renewed in installments, and businesses using the exemption must clearly state it in the application.

    This is also the part that is undergoing continuous change in 2025–2027: three new EU Mandatory Directives update a series of lead exemptions (groups 6, 7a, 7c) with deadlines falling on December 11, 2026, June 30, 2027 and December 31, 2027.

    7. Don’t confuse RoHS with other laws

    Ministry of regulations Core content Where is it different from RoHS?
    RoHS (2011/65/EU) Restrict 10 substances in electrical and electronic equipment Threshold calculated based on homogeneous material; attached with CE mark
    REACH (1907/2006) General chemical management; list of SVHC; obligation to declare and inform customers REACH applies chemicals and materials, not just electronics; limit calculated accordingly entire product (0.1% mass) rather than homogeneous material
    WEEE (2012/19/EU) Responsibility for recovery and treatment of electronic waste WEEE has no substance restrictions; WEEE is about registration, labels, recalls and costs
    ELV (2000/53/EC) Restrict substances in vehicles that have expired Same spirit but separate substance list and limit, applied to cars
    ESPR / Ecodesign Requires ecological design, product passport no This is a law on product design and information, which will interact with how to prove RoHS compliance
    Battery Regulation (EU) 2023/1542 Battery life cycle management: composition, recycled content, battery passport Products with batteries may be subject to both: RoHS for the device, Battery Regulations for the battery pack

    8. How to prove compliance? Overview of the test procedure

    RoHS does not mandate a single method; Enterprises choose their own way of proving. In practice, a RoHS testing procedure follows the following sequence:

    1. Get samples and product descriptions: Identify products, versions, components and materials.
    2. Dissection into homogeneous material: mechanical disassembly to the point where further separation is impossible — this is the step that determines the accuracy of the entire result.
    3. Screening by XRF: Quickly measure suspicious points to localize and classify risk levels.
    4. Try to confirm by wet method: ICP-OES/ICP-MS for metals; colorimetry or ion chromatography for Cr(VI); GC-MS for PBB/PBDE and phthalates.
    5. Evaluate by limit and prepare reports: Conclusions for each homogeneous material, with descriptions of samples, methods, equipment and measuring conditions.

    This string is in the method set IEC 62321 — international standard on how to identify restricted substances in electrical and electronic products. With technical documents, harmonized standards need to be known EN IEC 63000:2018.

    9. Five most common misunderstandings about RoHS

    1. “There is a RoHS certificate and that’s it.” RoHS does not have a certification mechanism. Obligations are technical documents and declarations of conformity under the name of the enterprise.
    2. “My product meets RoHS because the report says Pass.” Need to know that report Try it on any model: by sample (one piece) or by lot? Is this version for sale? Only the report does not say anything about the batch being delivered.
    3. “The 0.1% limit applies to the whole product.” Pressure limit follows homogeneous material. This is the root of most errors when businesses self-assess.
    4. “Chromium in the XRF report exceeds damage.” XRF only measures total chromium; need to confirm Cr(VI) before concluding.
    5. “RoHS is mandatory for the EU, but not for other countries.” China, Korea, Japan, EAEU, some US states… all have similar regulations, with different substance lists and label obligations. Details in the article comparing 6 markets.

    10. Frequently asked questions

    My product only has a small circuit board, does it have to comply with RoHS?

    Yes, if it is an electrical – electronic product marketed in the EU. Group 11 (“other electrical and electronic equipment”) is an open group, catching the remaining products from July 22, 2019. Small size does not change the obligation.

    The component supplier has submitted a RoHS report, do I need to retest?

    RoHS allows reliance on supply chain information in many cases, but the business remains ultimately responsible. The usual way is to assess the risk: high-risk components (PVC plastic, plating, low-temperature welds) are rechecked; For low-risk components, save the declaration. Details are in the article on XRF strategy and batch wet testing.

    Does RoHS require anything to be written on the product?

    RoHS does not have its own label. Label obligations come from the CE marking and, for some non-EU markets, from domestic labeling regulations (e.g. EFUP labels and Chinese logos).

    How often do I have to recheck?

    The directive does not set a fixed period. In fact, retesting is recommended when materials, components, suppliers, factories, or when substance lists and exemptions change — which is approximately once a year for products that are being sold regularly.

    What do Vietnamese businesses do when they do not have a legal entity in the EU?

    Need an authorized representative in the EU or sell through an importer on duty; Technical documents should still be available on the Vietnamese side, because when there is a problem, the request will be transferred back to the factory.

    Is RoHS recognized in many markets?

    Results from laboratories accredited to ISO/IEC 17025 are generally accepted by markets, but market-specific obligations vary (labels, declarations, product grouping). You should determine the market before choosing a trial package.

    11. Conclusion

    RoHS in one sentence: All electrical and electronic equipment marketed in the EU must ensure that 10 restricted substances do not exceed the limit (0.1%, especially cadmium 0.01%) calculated according to each homogeneous material; Enterprises self-prove with technical documents, self-declaration of conformity and CE marking, keeping records for 10 years.

    Three things to do immediately if you are exporting: one, check whether the product actually belongs to the exclusion list, instead of assuming; two, create a uniform material list for each product and localize risk points; three, monitor the 2026–2027 exemption deadlines if you are relying on the lead exemption.

    References

    • Directive 2011/65/EU on restriction of the use of hazardous substances in electrical and electronic equipment (amended consolidated version)
    • Directive (EU) 2015/863 — adding four phthalates to Annex II
    • Directive (EU) 2025/2456 — transfer of scientific and technical tasks to ECHA
    • European Commission — official page about the RoHS Directive (accessed September 28, 2026)
    • EN IEC 63000:2018 — technical document for the evaluation of electrical and electronic equipment with regard to the restriction of hazardous substances
    • IEC 62321 (series of standards) — defines certain substances in electrical and electronic products

    Related articles


    Discuss further


      Disclaimer

      This article is an explanatory content compiled by ourselves for the purpose of introducing and disseminating knowledge; not legal advice and does not replace legal documents. Figures and timelines are given for reference only, and may have been modified in a later version.

      For application to a specific product — design, testing, conformity assessment or commercial decision making — the reader should refer directly to the latest consolidated text of Directive 2011/65/EU on EUR-Lex, and consult an accredited testing body or consultant where necessary.

      See more: Copyright Policy & Disclaimer by ticforall.com.
      Cross-section in aviation and military: request records and retrieval

      0
      Cover image of the article «Cross-section in aviation and military: request records and retrieval»

      In the aerospace and defense supply chain, product quality isn’t just judged by samples — it’s judged by demonstrability. A solder joint that passes but cannot prove the procedure of creating it is still considered unqualified.

      This article presents the specific requirements that cross-section must meet in these two areas, and the points businesses need to prepare if they want to participate.

      1. Why are aviation and military the most demanding?

      • No chance to fix: The product operates where regular maintenance is not possible, and errors can cause serious consequences.
      • Very long life cycle: Equipment may have to operate stably for decades.
      • Retrieve required materials: Each batch of materials must be traceable to the source.
      • Process approval: The manufacturing process must be approved in advance, not just the product.
      • Records may be inspected: Records are part of the product, not supplementary documents.

      2. Specific requirements affecting cross-section

      Category Typical requirements Influences how to do things
      Laboratory capacity Usually requires an accredited testing laboratory for a specific range of tests Must use a room with sufficient capacity, or have a clear agreement with the customer
      Retrieve supplies Soldering supplies and circuit board materials must have batch documents Test records must be associated with the batch number of the material
      Calibrate the device Measuring equipment and microscopes must be within calibration Calibration documents must be saved with the report
      Process approval Sample preparation procedures must be approved in advance Do not change procedures or supplies without reporting
      Save the template Samples and records must be kept for a long time Need a system to store samples that are numbered and searchable
      Change control Any changes must be evaluated and approved Minor changes require reassessment and may require cutting the confirmation sample

      Note: specific requirements are specified by the customer or main contractor. Businesses need to take the list of applicable requirements from customers’ contracts and technical documents instead of assuming common standards.

      3. What are the test records needed?

      1. Sample information: Product code, batch number, related material number, manufacturing date.
      2. Test information: cutting position, cutting direction, applied sample preparation process.
      3. Results: The image has a scale, magnification, and measurement results for each criterion.
      4. Applicable criteria: approved standards, quality levels, and thresholds.
      5. Device information: Device code and valid calibration date.
      6. Personnel information: implementer, checker, approver.
      7. Abnormal recording: any deviation from the approved procedure, even if it does not affect the results.
      Sample analysis table with microscope and laboratory documentation
      In these two areas, records are part of the product and not accompanying documents.

      4. Common traps when preparing documents

      Trap Consequences How to avoid
      Do not associate results with batch numbers of materials Unable to trace the source when there is a problem Record the batch number of materials right on the sample file
      Photo has no scale Size cannot be verified Specify the scale as a required field in the form
      Do not record minor changes to the procedure Considered a document falsification during inspection Note any deviations, no matter how small
      Do not save the template Unable to answer questions that arise later Maintain a numbered sample filing system
      Use equipment that is out of calibration The results may not be acceptable Check the calibration period before each test
      Empirical interpretation of the criteria Inconsistent between batches Attach conclusions to approved criteria and thresholds

      5. Sample preparation process needs to be stable

      A point that gets little attention: in these two fields, the sample preparation procedure is considered part of the test and must be stable. Changing grinding consumables, cutting tools or molding material suppliers without notice may render the record invalid.

      • Record the sequence of steps and materials used for each batch.
      • Only change materials when there is a reason and after evaluating the impact.
      • Maintain control samples between batches to detect process drift.
      • Periodic training for people performing sample preparation.
      Sample preparation tools and plastic molding samples are arranged on the laboratory table
      Stability of the sample preparation process is a condition for results between batches to be comparable.

      6. Roadmap if requirements are not met

      1. Compare actual requirements from contracts and customer technical documents, rather than assumptions.
      2. Build internal processes based on standardized test methods.
      3. Build report forms There are enough information fields according to profile requirements.
      4. Set up a sample storage system Numbered and searchable.
      5. Maintain equipment calibration and save complete documents.
      6. Agree with customers about criteria, thresholds and test ranges before starting.
      7. Evaluate testing room capacity and determine which tests need to be performed in an accredited laboratory.
      Sample storage drawer with numbered trays and laboratory magnifying light
      Numbered form retention is a practical requirement in both the aerospace and defense sectors.

      7. Frequently asked questions

      Is it mandatory for testing laboratories to be accredited?

      Depending on customer requirements and product characteristics. Some tests are required to be performed in a qualified laboratory; some can be done internally if there is adequate agreement and control.

      How long do records need to be kept?

      According to the deadline specified in the contract or customer’s request. This period is usually much longer than for consumer products.

      Can I use a saved sample from a previous batch instead of cutting a new one?

      Not if the batch or process has changed. The saved form is used to answer questions that arise, not to replace current formative assessment.

      Do grinding consumables changes need to be reported?

      According to change control principles, reporting should be done when the procedure has been approved. Even if not required, recording helps keep records consistent and easy to explain when needed.

      Where should I start if I want to join this supply chain?

      From getting a complete list of customer’s actual requirements, then standardizing the procedure and application forms. These are two factors that determine responsiveness.

      8. Conclusion

      For aviation and defense, cross-section is not just a technical test but part of a quality proof system. Correct results are not enough — they must be accompanied by verifiable and traceable records.

      Four things to do: get enough actual requirements from customers instead of assuming; standardize sample preparation and stability procedures; Build a profile form with enough information fields; and maintain sample storage system and calibration documents.

      References

      • IPC-TM-650 Method 2.1.1 — Microsectioning.
      • IPC-A-610 — Electronic Assembly Acceptance Criteria.
      • J-STD-001 — Requirements for electrical soldering and electronic assembly.
      • IPC-6012 — Technical requirements for rigid printed circuit boards.

      Related articles


      Discuss further


        Disclaimer

        This article is an interpretive content compiled by us; not legal advice. Enterprises need to compare relevant documents/standards verbatim before applying them to specific products.

        See more: Copyright Policy & Disclaimer by ticforall.com.
        IPC-7095: void criteria for level-specific BGA

        0
        Cover image of the article «IPC-7095: void criteria for level-specific BGA»

        Void in BGA solder joints is the most controversial topic in electronic quality testing. One side considers every void an error; The other side believes that small voids are a normal characteristic of the procedure. Document IPC-7095 exists to provide a systematic review rather than a perceptive argument.

        This article presents the leveled void approach, the correct way to measure it, and what to keep in mind when comparing measurement results with criteria.

        1. What is IPC-7095?

        IPC-7095 is a guide to the design and assembly of ball bearing components. Content related to quality control covers how to evaluate voids in ball solder joints, including classification by level and different treatments for each level.

        Concept Content
        Void Air bubbles form in the solder joint during the melting process
        Sort by level How to evaluate void varies depending on the level and purpose of product use
        Criteria by position Voids in critical binding areas are evaluated more severely
        Scope of application Used for ball-shaped components and components with large soldering irons

        Note on scope: specific numerical thresholds are specified in the body of the standard document. When applied to specific products, businesses need to compare directly with the standard and agree with customers.

        2. Why is void not always an error?

        Void forms naturally during the melting process: gases from the flux, moisture and air are trapped as the tin solidifies. So in reality almost every solder joint has a certain amount of void.

        What determines whether void is a problem or not are three factors:

        1. Size: Large void reduces local electrical and thermal conductivity.
        2. Location: The void located in the area connected to the pad or in the bearing area has a much greater influence than the void in the middle of the tin block.
        3. Distribution: many small, scattered voids are usually less serious; a large centralized void is the problem.
        Cross-section of BGA balls under a microscope with small bubbles inside the tin block
        Void itself is not an error; It is the size, location and distribution that determine the severity.

        3. How to measure void properly

        Parameters How to determine Why is it necessary?
        Ratio of void to total area Total void area divided by the cross-sectional area of the ball Reflects the overall reduction in cross-sectional area
        Largest void size Measure the diameter or area of the largest void Reflects the level of stress concentration
        Void location Determined by layer: near pad, middle ball, near package The void in the link area is more important than the void in the middle
        Large amount of void Counts the number of voids that are noticeably oversized Distinguish scattered void from concentrated void

        Indicating a percentage while ignoring size and location is an understatement and often leads to unnecessary disputes.

        4. How does Void affect location?

        Void location Influence Levels to note
        Located at the interface with the pad Reduces the bond area, weakening the connection point both mechanically and electrically High — needs careful assessment
        Located in the middle of the tin block Little effect on links if not too great Lower, depending on size
        Located on the package side Affects the link to the pad on the package High if concentrated
        Located at the edge of the solder joint May reveal link borders Need to consider specific shape
        Scattered with many small voids Usually does not significantly affect durability Low, but need to watch the trend
        Magnified cross-sectional image of the solder ball with a large void located close to the pad interface
        A void located close to the bond interface is much more of a concern than a void located in the middle of the tin block.

        5. X-ray and section when comparing criteria

        Method Let me know Don’t tell
        X-ray The ratio of void to the projection of the ball; Check multiple marbles at once Void position in depth; bond state at the interface
        Cross-sections Void position in depth; surrounding link status Void ratio of the entire row of balls; Only applies to cut balls

        Practical consequence: for the same ball, the void ratio measured by X-ray and the void ratio measured by cross-section may be different. This doesn’t mean one method is wrong — the two methods measure two different quantities. Therefore, the report must clearly state the method used.

        6. Evaluation and reporting process

        1. Determine the applicable level for the product and agree with the customer before measuring.
        2. Use X-ray for screening and localize balls with large voids.
        3. Cut the section at the questionable balls, with at least one reference ball.
        4. Record three parameters for each void: scale, largest size, position.
        5. Compare criteria by level and clearly state the conclusion for each cut ball.
        6. State the limit of conclusion: applies to tested balls, does not generalize to all components if there are not enough samples.

        7. Common points of dispute

        • Difference between ratio measured by X-ray and by cross-section: Due to the nature of the two different measurements, it is not an error.
        • Acceptance thresholds vary between customers: Written agreement is required before evaluation.
        • Voids in different locations are treated the same: leading to conclusions that are too strict or too lenient.
        • Evaluation from just one word: does not represent the entire row of balls or components.
        Plastic molded BGA components and control samples are placed on the analysis table
        Always have a control sample in the same test for a well-founded assessment.

        8. Frequently asked questions

        Is there a common void threshold for all products?

        No. The threshold depends on the level of application, product requirements and agreement with the customer. It is essential to agree on thresholds before testing.

        Do small evenly distributed voids need to be reported?

        Reporting is recommended to have data to monitor process trends, even if results are still satisfactory.

        Does Void progress over time?

        It is possible, especially with components working at high temperatures. Void tends to spread with thermal cycles, so the assessment after the heat test has a different meaning than the assessment immediately after solder jointing.

        Should I cut the entire row of balls to evaluate?

        If the goal is to evaluate uniformity within a row, cutting along that row should be done. If the goal is to confirm a specific location, cutting in the right location is enough.

        Can cross-section results be used as evidence?

        Yes, the report clearly states the cutting location, measurement method, application level and includes a photo with a scale. These are factors that help verify results.

        9. Conclusion

        Void is a natural phenomenon of the solder jointing process, not a default sign of error. What needs to be done is a systematic assessment: measure all three parameters, consider the location, and compare with the agreed application level.

        Four things to do: agree on levels and thresholds before measuring; Use X-ray for screening and section for confirmation; Record full scale, maximum size and location; and clearly state the limits of the conclusion according to the number of samples tested.

        References

        • IPC-7095 — BGA design and assembly.
        • IPC-A-610 — Electronic Assembly Acceptance Criteria.
        • J-STD-001 — Requirements for electrical soldering and electronic assembly.
        • IPC-TM-650 Method 2.1.1 — Microsectioning.

        Related articles


        Discuss further


          Disclaimer

          This article is an interpretive content compiled by us; not legal advice. Enterprises need to compare relevant documents/standards verbatim before applying them to specific products.

          See more: Copyright Policy & Disclaimer by ticforall.com.

          J-STD-001 and IPC-A-610: evaluation of solder joints through cross-section

          0
          Cover image of the article «J-STD-001 and IPC-A-610: evaluation of solder joints through cross-section»

          The two standards most mentioned when talking about solder jointing quality are J-STD-001 and IPC-A-610. They are often used interchangeably, but their roles are different: one specifies process requirements, the other specifies acceptance criteria for inspection.

          This article explains how to use these two standards when evaluating cross-section solder joints, and what points to keep in mind for a well-founded conclusion.

          1. Two standards, two roles

          Standard Role When to use?
          J-STD-001 — Requirements for electrical soldering and electronic assembly Specifies requirements for materials, equipment and processes When setting up and controlling the solder jointing process
          IPC-A-610 — Electronic Assembly Acceptance Criteria Regulations on how to evaluate whether a product passes or fails When testing and drawing conclusions about the product

          In short: J-STD-001 answers “how to do it”, IPC-A-610 answers “what is considered successful”. A good report should cite both when it comes to assessing causes and quality conclusions.

          2. Quality level affects criteria

          Both standards are classified by quality level, and the quality level determines the stringency of the criteria. Therefore, the conclusion “satisfactory solder joint” must always be accompanied by the applicable level.

          Granted Applicable characteristics Consequences when evaluating
          Level 1 Requires basic functionality Some defective characteristics may be acceptable
          Level 2 Higher requirements for stability More restrictions on allowable disabilities
          Level 3 Requires high reliability The strictest criteria, prioritizing ongoing reliability

          3. Welding criteria evaluated through cross-section

          Target Features to read Signs to pay attention to
          Fillet shape Concavity and continuity of the tin surface Convex surface, broken corners, clear boundaries
          Foot absorbency The tin level follows the components Stick too little or lean to one side
          Metal bond There is an intermetallic strip at the interface No banding or discontinuous banding is seen
          Cracks in the solder joint Crack location and direction Cracks at the heel, cracks parallel to the interface
          Void Proportion, maximum size and location Large void in the bearing area or heat conduction area
          Gap between pin and tin Is there a gap between the pin metal and the tin? Clearance along component legs
          Weld section with component root under microscope with concave fillet
          Most solder joint criteria are developed for surface observation, so when used for cross-sections, careful interpretation is required.

          4. Limitations when applying surface inspection criteria to cross-sections

          IPC-A-610 is designed primarily for visual and optical inspection of product surfaces. When applied to cross-sectional images, there are three points to note:

          1. The shape on the section depends on the cutting plane: same solder joint, cut in different position for different shape. Therefore, it is not possible to directly compare the shape on the cross-section with the description of the surface shape.
          2. Some features exist only on the surface: for example, the gloss or color of the tin surface — things that cannot be read on the cut surface.
          3. Some features can only be seen on the cross-section: metallic bonds, intermetallic compound (IMC) layers, internal voids — things the surface testing criteria don’t cover.

          Correct usage: consider the cross-section as an additional data source, clearly stating which features are read from where, instead of trying to assign all surface criteria to the cross-section image.

          5. Procedure for evaluating solder joints on cross-section

          1. Determine the type of solder joint and the applicable quality level.
          2. Determine cutting position and direction used, diagram included.
          3. Read each indicator in the table in section 3 and record the results of each indicator separately.
          4. Compare with criteria of applicable standards and levels.
          5. Specify limits: The results only apply to the cut sample, to the selected cutting plane.

          6. The role of J-STD-001 in cross-sectional assessment

          When the section shows a defect, the next question is whether the defect is of process origin. J-STD-001 is useful at this step because it specifies process requirements: temperature, time, materials, and equipment control requirements.

          • Compare actual thermal profile with process requirements.
          • Check the type and condition of solder jointing materials and flux.
          • Check device condition and calibration status.
          • Check cleaning and post-solder joint treatment requirements.
          Magnified cross-sectional image of the solder joint with the intermetallic strip at the interface
          Metallic bonding is a characteristic that cannot be evaluated by surface inspection criteria, but the cross-section can be read.

          7. Common errors when drawing conclusions

          • Apply surface criteria to the cross-section image: leads to wrong conclusions because the two data sources are of different nature.
          • No quality level stated: conclusions cannot be compared.
          • Conclusion for the whole lot from one sample: a section represents only the plane itself.
          • Skip design: has unusual characteristics in shape but conforms to the intended pad and stencil design.
          • No reference to standards: The conclusion has no basis for comparison or defense.
          Plastic molded solder joint samples and standard documents are placed on the analysis table
          Weld conclusions should be tied to both process requirements and applied acceptance criteria.

          8. Frequently asked questions

          Is it possible to conclude “pass” based on cross-section alone?

          Yes, for the cut sample itself and for the characteristics observed on that cut section. It is not possible to extrapolate to the entire lot from just one sample.

          If the shape on the cross-section is different from that described in the standard, how to handle it?

          Check the cutting position and direction first. The unusual shape is due to a different cutting plane, not necessarily a defect.

          Which quality level should be applied?

          According to customer’s request or according to applicable market. This level must be clearly stated in technical documents before production.

          Is Void considered an error by the acceptance criteria?

          Not automatically. It is necessary to consider the ratio, maximum size, location and requirements of the product. With heat-conducting or load-bearing components, the criteria are often more stringent.

          What else should be checked besides the cross-section?

          A combination of AOI or optical testing to evaluate surface characteristics, and electrical measurements to evaluate functionality is recommended. Cross-sections add a layer of information that the other two methods do not have.

          9. Conclusion

          J-STD-001 and IPC-A-610 are not interchangeable: one is about process requirements, the other is about acceptance criteria. When evaluating solder joints through cross-sections, it is necessary to clearly distinguish which characteristics can be read from the cross-section and what limitations this method has.

          Four things to do: clearly state standards and quality levels in the report; Do not apply surface criteria to the cross-sectional image; Read each indicator separately and write separate conclusions; and clearly state the limits of conclusions according to the cut sample.

          References

          • J-STD-001 — Requirements for electrical soldering and electronic assembly.
          • IPC-A-610 — Electronic Assembly Acceptance Criteria.
          • IPC-TM-650 Method 2.1.1 — Microsectioning.
          • IPC-7095 — BGA design and assembly.

          Related articles


          Discuss further


            Disclaimer

            This article is an interpretive content compiled by us; not legal advice. Enterprises need to compare relevant documents/standards verbatim before applying them to specific products.

            See more: Copyright Policy & Disclaimer by ticforall.com.

            IPC-TM-650 2.1.1: standard microsection procedure

            0
            Cover image of the article «IPC-TM-650 2.1.1: standard microsection procedure»

            Two testing rooms do the same cross-section but give different results — the reason often lies not in the skills but in the procedure. IPC-TM-650 Method 2.1.1 exists to solve exactly that problem: standardizing how samples are prepared and how microsection testing is performed.

            This article describes the role of this test method, the steps to be followed, and the control points that directly affect the results.

            1. What is IPC-TM-650 and Method 2.1.1?

            IPC-TM-650 is a set of documents that collects test methods for materials and electronic products. Method 2.1.1 in this set specifies how to perform microsection — that is, cutting, molding, grinding, and polishing the sample to observe the internal structure under a microscope.

            Concept Content
            Microsection Sample destruction method to observe the internal structure along the cutting plane
            Purpose Check the board structure, solder joints, plating and interfaces
            Nature Destructive method, results only apply to cut samples
            Role of 2.1.1 Standardize the execution sequence and conditions so that results can be compared between times and between rooms

            Note on scope: detailed specifications (type of abrasive, abrasive sequence, pressure, polishing steps, photo requirements) are specified in the standard text. When applying, businesses need to compare directly with the standard instead of relying on indirect descriptions.

            2. Why is process standardization important?

            1. Results must be comparable: Without a standard process, it is impossible to know whether the difference is due to the sample or the method.
            2. Destroyed samples cannot be redone: Making a mistake in the preparation step means losing the opportunity to observe.
            3. Sample preparation can create spurious defects: Scratches, burrs, and fake gaps are all easily read as real defects.
            4. Conclusions must be verifiable: The third party needs to know in what order the sample was processed.

            3. Process steps

            Step Purpose Main control point
            Choose the location and cut the pattern Insert the cutting plane through the area to be surveyed Cutting direction, speed and cutting force are suitable for the material
            Clean the sample Remove impurities before casting Does not leave residue that affects the adhesion of molded plastic
            Casting samples Fix the sample for grinding without deforming it Suitable molding resin, limiting air and voids
            Rough grinding Bring the sample face close to the plane to be observed Pressure and time; Avoid grinding too deeply and losing the survey area
            Fine grinding and polishing Remove scratches, create observable surface The abrasive grain sequence gradually decreases, the pressure gradually decreases
            Clean and dry Removes abrasive particles and impurities from the surface Do not leave particles on the surface before shooting
            Observe and measure Record characteristics and measure dimensions The magnification is appropriate, there is a scale in the photo
            Grinding machine polishes metal samples and plastic molding samples on the laboratory table
            Abrasive grain sequence and pressure are the two parameters that most clearly affect sample surface quality.

            4. Requirements for samples and cutting positions

            • The cut location must be representative for the area to be evaluated, do not choose based on convenience.
            • The cutting direction must be appropriate with the structure to be observed: longitudinal cutting for through holes, perpendicular cutting of ball rows for ball-shaped components.
            • Need control sample prepared under the same conditions to distinguish true abnormalities from normal features.
            • Need a background image first to try if the sample will undergo subsequent environmental or mechanical testing.

            5. Requirements for equipment and supplies

            Category Role Impact when inappropriate
            Pattern cutting machine Cut without deforming the material Fake cracks, metal burrs, missing areas to be investigated
            Casting material Fixed sample False gap, sample deflection during grinding process
            Grinding and polishing supplies Create observable surface Scratches, loss of thin layers, distorted planes
            Optical microscope Observe and take photos The interface and thin layer are not visible
            Measuring device on photo Measure dimensions with reference Data cannot be verified
            Photo of the solder joint cross-section taken under a microscope with a scale
            The photo must have a scale so that the numbers in the report can be independently verified.

            6. Common errors in practice

            1. Skip the intermediate step when grinding: jumping from coarse to fine grain to save time, leading to deep scratches that cannot be treated.
            2. Pressing too hard when grinding: causes burrs and deforms the soft metal layer.
            3. Do not clean between steps: The remaining abrasive particles from the previous step create new scratches.
            4. Grinding too deep: removal of the intermetallic compound (IMC) layer or thin coating layer to be evaluated.
            5. Shoot at only one magnification: Missing overall information or missing details, depending on the magnification selected.
            6. Do not record the performed sequence: results cannot be reproduced or interpreted in dispute.

            7. Take notes so the results can be verified

            • Cutting location and direction, with diagram or photo showing location on the product.
            • Sequence of grinding and polishing steps performed.
            • Magnification of each image and corresponding scale.
            • Control sample information and background image, if available.
            • Standards and quality levels are used to evaluate results.
            Process documents and plastic molding samples are stacked on the analysis table
            Adequate recording is a condition for results to be valid when reviewed several months later.

            8. Frequently asked questions

            Is this procedure mandatory?

            Depending on customer requirements and applicable quality system. In many cases, the reference to a standardized test method is a condition for the results to be accepted in dispute.

            Is it possible to build internal processes yourself?

            Yes, but should be based on standardized test methods and clearly state deviations from standards, if any.

            Where to get detailed technical specifications?

            Taken directly from the test method content in the standard document. This article only presents the general role and sequence.

            Does a wrong mold have to be made again?

            It often has to be done again, because the sample has been cut and ground. This is why it is important to prepare enough backup samples from the beginning.

            Do I need to take photos at multiple steps?

            Should be taken at important steps, especially before deep grinding. If a problem is detected, the photos from the previous step help determine whether the cause is in the sample or in the preparation process.

            9. Conclusion

            The value of the cross-section lies in the reliability of the results, and that reliability depends directly on compliance with the standardization process. A properly prepared sample gives results that are comparable, reproducible, and defensible in the event of dispute.

            Four things to do: follow the grinding and polishing sequence, don’t skip steps; Control pressure at every stage; Full recording of cut position, sequence and magnification; and always prepare control samples under the same conditions.

            References

            • IPC-TM-650 Method 2.1.1 — Microsectioning.
            • IPC-6012 — Technical requirements for rigid printed circuit boards.
            • IPC-A-600 — Acceptance criteria for printed circuit boards.
            • J-STD-001 — Requirements for electrical soldering and electronic assembly.

            Related articles


            Discuss further


              Disclaimer

              This article is an interpretive content compiled by us; not legal advice. Enterprises need to compare relevant documents/standards verbatim before applying them to specific products.

              See more: Copyright Policy & Disclaimer by ticforall.com.

              IPC-A-600 and IPC-6012: cross-section board acceptance criteria

              0
              Cover image of the article «IPC-A-600 and IPC-6012: cross-section board acceptance criteria»

              When evaluating a circuit board on its cross-section, the question “this board passes or fails” cannot be answered without clearly stating which standard is being applied. The two most commonly referred to documents are IPC-A-600 and IPC-6012 — and they are not substitutes for each other.

              This article explains the scope of each standard, what to read on the board cross-section, and how the quality level affects the conclusions.

              1. Two standards, two scopes

              Standard Scope Answer the question
              IPC-A-600 — Acceptance criteria for printed circuit boards Bare circuit board, no components installed Does the printed circuit board meet the requirements in terms of structure and manufacturing quality?
              IPC-6012 — Technical requirements for rigid printed circuit boards Technical requirements that the board must meet What requirements must the circuit board be manufactured according to?

              In short: IPC-6012 states the requirements, IPC-A-600 states how to determine pass or fail compared to that requirement. When a cross-sectional report cites only one of the two, the conclusion is often unsubstantiated.

              2. Why is it necessary to read both when cutting samples?

              • Avoid applying wrong criteria: Using bare board criteria to evaluate soldered boards is a common mistake.
              • Assignment of responsibilities: the error is in the bare board belonging to the board supplier; Errors that arise after solder jointing may be part of the solder jointing process.
              • Determine the correct quality level to apply: The same characteristic may pass at one level but fail at another.
              • Make sure the conclusions can be compared: The report clearly states the standards and applicable levels so that a third party can verify it.

              3. Reading indicators on the circuit board cross-section

              Target Characteristics to evaluate Signs to pay attention to
              Plated hole quality Continuity and evenness of the plating layer according to depth Localized thin plating, holes, cracks
              Contact ring around hole Excess material between hole edge and pad edge Lack of material, drill hole deviated from the center of the pad
              Copper layer thickness Thickness of the copper layer on the surface and in the hole Big difference between positions
              Condition of base material There are separations, burn marks, and strange impurities Gaps between layers of material, discolored streaks
              Borehole fluctuations Straightness of hole wall according to depth The wall of the hole is not straight and has steps
              Corrosion level Signs of corrosion on the surface and in the hole The edges of the material are concave and have crystallized salt
              Cross-section of a multi-layer circuit board under a microscope showing plating holes and copper layers
              Cross-section is a tool to inspect the board structure in depth that no other method can provide.

              4. How does quality level affect conclusions?

              Quality level Typical product type Required level
              Level 1 Consumer products, basic requirements Prioritize functionality, accept certain flawed characteristics
              Level 2 Industrial products, specialized equipment Higher requirements on stability, more limited on allowed defects
              Level 3 Products requiring high reliability, critical equipment The most stringent requirements, prioritizing continuous reliability

              Since the same characteristic may pass at one level but fail at another, the section report must clearly state the applicable quality level. A “pass” conclusion without stating the level of application is an unverifiable conclusion.

              5. Cut the sample on the product or on a separate test sample?

              1. Coupon: used to evaluate the board manufacturing process, which can be periodically monitored in batches.
              2. Cut on real product: correctly evaluates the area of concern, but destroys a product.
              3. Combine both: Separate test samples to evaluate the procedure, cut products when needing to verify specific positions.

              One thing to note: results on individual test samples do not automatically translate to the real product, because the placement conditions and hole density may be different. If only data from a single test sample are available, this limitation should be clearly stated in the report.

              6. Common errors when presenting reports

              • Standards and quality levels are not stated: conclusions cannot be compared.
              • Mix bare board criteria with soldered board criteria: leading to erroneous conclusions about responsibility.
              • Do not record cutting position and cutting direction: cannot be compared with other tests.
              • Missing images at high enough magnification for the transition zone: miss small but serious defects.
              • There is no control sample: Unable to distinguish true abnormalities from normal characteristics.
              Cross-sectional image magnifying the transition area between the plated hole and the pad on the board
              The transition zone between the plated hole and the pad is where the acceptance criteria are most stringently applied.

              7. Procedure for reading a circuit board cross-section

              1. Overall determination: number of layers, board thickness, hole position in cross-section.
              2. Plated hole rating: continuity, evenness, whether there are cracks or not.
              3. Contact ring rating: material excess, eccentricity.
              4. Base material evaluation: separation, burning, impurities.
              5. Compare criteria: Compare each criterion with the applicable standards and levels, clearly state the conclusions for each criterion.
              Plastic molded circuit board samples and standard documents on the analysis table
              Conclusions are only valid when associated with a specific standard and quality level.

              8. Frequently asked questions

              Can IPC-A-600 and IPC-6012 be used interchangeably?

              No. One side states technical requirements, the other side states acceptance criteria. Both are needed for a full conclusion.

              Can soldered circuit boards apply IPC-A-600?

              Can be used for the board structure, but the solder joints must apply assembly standards. Mixing the two scopes is the source of many disputes.

              Who decides the quality level?

              Usually applied by customers or according to market requirements. It is important that this grade is clearly stated in the technical documentation prior to production.

              Is it necessary to cut samples periodically, or only when there is a problem?

              It is recommended to have a recurring plan in batches, especially with multi-layer and small-hole products. Periodic testing detects process drift trends before mass errors occur.

              What if the board meets IPC-A-600 but the product is still defective?

              Additional off-board factors need to be checked: soldering process, design, assembly stress and usage conditions. Meeting structural criteria does not mean meeting reliability requirements in all conditions.

              9. Conclusion

              Evaluating the circuit board on the cross-section is only valid when attached to the correct standards and quality levels. IPC-6012 tells the requirements, IPC-A-600 tells how to determine pass or fail — without either, the conclusion will be difficult to reconcile.

              Four things to do: clearly state standards and quality levels in every report; Distinguish between bare board and soldered board evaluation; clearly state the location and direction of cutting; and present conclusions according to each indicator instead of a general conclusion.

              References

              • IPC-6012 — Technical requirements for rigid printed circuit boards.
              • IPC-A-600 — Acceptance criteria for printed circuit boards.
              • IPC-TM-650 Method 2.1.1 — Microsectioning.
              • J-STD-001 — Requirements for electrical soldering and electronic assembly.

              Related articles


              Discuss further


                Disclaimer

                This article is an interpretive content compiled by us; not legal advice. Enterprises need to compare relevant documents/standards verbatim before applying them to specific products.

                See more: Copyright Policy & Disclaimer by ticforall.com.

                5 strange marks on the cross-section: distinguish real errors from phenomena due to sample preparation

                0
                Cover image of the article «5 strange marks on the cross-section: distinguish real errors from phenomena due to sample preparation»

                In a set of cross-sectional images, not everything that looks strange is a defect. Cutting, casting, and grinding samples also create marks — and those marks can look a lot like real cracks, real delamination, or faulty solder joints. Mistakes at this point are doubly costly: the factory both goes in the wrong direction and loses credibility with partners when the mistake is discovered.

                This article reviews five common strange marks, how to distinguish them from real defects, and what to control during sample preparation.

                1. Five strange and common traces

                Traces The reason is sample preparation How to distinguish from real errors
                Parallel scratches The abrasive grain of the abrasive paper creates grooves on the surface Parallel, even, only on the surface layer, can be re-sharpened to finish
                Metal burrs are pulled Too much pressure causes the soft metal to stick to the cutting edge The metal strip is long, thin, lying on top of the surface instead of digging into the material
                Cracking due to shear force The cutting edge exerts strong impact on brittle materials Appears from the edge of the sample in, following the cut line
                False gap due to casting The molded plastic does not penetrate completely into the small gap, leaving a void The void has a molded shape, often in a place where penetration is difficult
                Loss of plating or intermetallic compound (IMC) layer Over polishing, the thin layer is erased There is no intermetallic strip visible but there are traces of beveled edges, the thickness gradually decreasing towards the edge
                The plastic molded sample is placed under a stereo microscope on the laboratory table
                The sample surface always contains both information about defects and traces of the preparation process.

                2. General principle of distinction

                1. Direction: Traces due to sample preparation are usually oriented in the direction of the cutting edge or grinding direction, not in the direction of structural stress.
                2. By location: Traces due to sample preparation are usually located in the surface layer or at the edge of the sample, rarely deep in the material.
                3. According to repetition: If you grind again and the mark disappears, there is a high possibility that it is a machining mark. The real error remains after resharpening.
                4. By form: True defects often have clear edges, sometimes with associated secondary traces (oxidation, deformation, adjacent voids); Machining traces are usually clean, even, and unidirectional.
                5. According to control sample: Compared with well-prepared samples, machining traces tend to be similar across many samples, while true errors are unevenly distributed.

                3. Transition rim — the easiest place to get confused

                The transition zone between materials is where many real defects are concentrated, but it is also where the grinding process easily creates burrs and drag marks. This is an area that needs to be observed at high magnification and compared with many samples before drawing conclusions.

                Signs of burrs in this area: soft metal is pulled over the surrounding harder material, creating the feeling of an unusually thick layer of metal. If polished again at a lighter step, this layer disappears.

                Exaggerated cross-sectional image of the transition zone with small scratches and cracks
                In the same area, grinding scratches and true microcracks can be next to each other and look very similar.

                4. Control points when preparing samples

                Step Control point Consequences if done wrong
                Cut the pattern Choose the right blade for the material, control the speed and cutting force Fake cracks, metal burrs
                Casting samples Use vacuum casting or cold casting, gas control False gap, void that looks like void
                Rough grinding Control pressure and time Loss of thin plating layer, erasing the area to be investigated
                Polishing Using a gradually decreasing abrasive strip, lightly polish Scratches, scratched metal surfaces
                Clean Wash off abrasives and impurities before shooting Particles stuck to the surface look like defects
                Take photos Enough light, enough magnification, with scale Difficult to assess size and morphology

                5. Checklist before concluding

                • Re-sharpened and checked to see if the marks are still there or gone.
                • Compared with the control sample prepared under the same conditions.
                • Checked whether the direction of the trace was in the structural direction or in the machining direction.
                • The possibility of abrasive grains or metal burrs has been ruled out.
                • Observed at high magnification at the transition zone.
                • Suspicious traces were clearly noted in the report instead of ignored or confirmed.
                Sample preparation tools and molded samples are arranged on the laboratory table
                Controlling each step of sample preparation is the cheapest way to avoid erroneous conclusions.

                6. Frequently asked questions

                How do you know if a crack is real or caused by cutting?

                Grind again and observe. If the crack remains and its direction is related to the structure, it is a true crack. If lost or changed in the direction of grinding, it is a machining mark.

                Could the gap between the coating and the surface be due to casting?

                Yes. If the molding resin does not penetrate completely into the small gap, it will leave a gap that looks like peeling. It is necessary to distinguish by the shape of the void and the degree of filling in the adjacent area.

                Is loss of intermetallic compound (IMC) layer a solder jointing error?

                Not always. The intermetallic compound (IMC) layer is very thin so it can easily be erased when polished too hard. It is necessary to check for signs of chamfering at the edge and compare it with a sample prepared more gently.

                How many samples should be used to make a clear distinction?

                Three samples are a reasonable minimum: if the same mark appears in all three and all have the same orientation, it is likely to be a machining mark. Real errors usually do not repeat exactly the same way.

                If still not sure, what is the conclusion?

                Record the level of certainty in the report and clearly state the suspected traces, with on-site photos. An honest statement of uncertainty is more valuable than a definitive but wrong conclusion.

                7. Conclusion

                The quality of a cross-section report depends not only on image reading skills but also on sample preparation discipline. Machining traces can lead to wrong conclusions, and wrong conclusions lead to wrong corrective actions — much more expensive than the initial cost of properly preparing the sample.

                Four things to do: always re-sharpen to confirm the mark; eliminate burrs and abrasives before concluding; Prepare at least three samples to evaluate repeatability; and clearly state points of doubt instead of over-confirming them.

                References

                • IPC-TM-650 Method 2.1.1 — Microsectioning, sample preparation section.
                • IPC-A-610 — Electronic Assembly Acceptance Criteria.
                • IPC-6012 — Technical requirements for rigid printed circuit boards.
                • J-STD-001 — Requirements for electrical soldering and electronic assembly.

                Related articles


                Discuss further


                  Disclaimer

                  This article is an interpretive content compiled by us; not legal advice. Enterprises need to compare relevant documents/standards verbatim before applying them to specific products.

                  See more: Copyright Policy & Disclaimer by ticforall.com.

                  From cross-sectional image to root cause: 5 investigation steps

                  0
                  Cover image of the article «From cross-sectional image to root cause: 5 investigation steps»

                  A good cross-section only answers the “what” question. The real question that gets a factory meeting is “why” — and the gap between the two is where many quality investigations go astray.

                  This article presents a five-step process from cross-sectional image to root cause, along with common mistakes and a set of criteria to know when the conclusion is strong enough.

                  1. Why is cross-sectional image not the answer by itself?

                  Cross-sectional images show the shape of the defect: where is the crack, what shape is the void, which layer is separated. But the same form can be caused by many different causes. If we jump to conclusions from the form, it’s easy to choose the wrong corrective action — and correcting the wrong area is more expensive than not correcting it.

                  Therefore, the investigation process must separate two things: describing the phenomenon, and tracing the cause. Step one is done by eye and microscope. Step two is made of data.

                  2. Five steps of investigation

                  Step Central question Data needed Output products
                  1. Describe the phenomenon What do you actually see? Cross-sectional images with multiple magnifications, control sample images The description is objective, without inference
                  2. Identify the damaged floor Is the defect in the base material, plating, solder joints, or components? Image at high magnification at the transition zone List of potentially relevant floors
                  3. Build a hypothesis and timeline At what stage can this phenomenon form? Process diagram, step list, parameter data List of hypotheses in order of priority
                  4. Compare process data Which hypothesis does the actual data support or rule out? Heat log, force log, re-solder joint history, material change The leading hypothesis remains
                  5. Verify by reference test Can the phenomenon be reproduced? Test samples with controlled variables and control samples Conclude the root cause with evidence
                  Cross-sectional images at various magnifications on the analysis table
                  The investigative process begins with an objective description rather than a premature conclusion.

                  3. Details of each step

                  Step 1 — Describe the phenomenon, not infer

                  • Record the location, size, and direction of each observed trace.
                  • Shoot at at least two magnifications: one to see the whole picture, one to see the details.
                  • Always take photos with the control sample at the same magnification.
                  • Do not use words that describe the cause in this step.

                  Step 2 — Identify the failed floor

                  Structural errors on circuit boards typically fall into one of four levels: substrate material, metal plating, solder joints, or component bodies. Determining the correct floor will localize the supplier and related process.

                  Step 3 — Build a hypothesis and assign a timeline

                  For each trace, list all the moments in the product life cycle that could have been created: material acquisition, solder jointing, paneling, assembly, testing, transportation, use. Then gradually eliminate based on the nature of the trace — for example, cracks with oxidized edges are difficult to form in the final step.

                  Step 4 — Compare process data

                  This is the step that distinguishes between speculation and conclusion. Data to compare: heat log of solder jointing furnace, contact time, number of re-solder jointing times, change of material supplier, change of machine parameters, clamping force and tightening torque.

                  Step 5 — Verify with control test

                  The conclusion is only as strong as it is reproducible: change exactly one variable, keep the rest constant, and see if the phenomenon appears as predicted. If it cannot be reproduced, it is necessary to reconsider the hypothesis instead of drawing conclusions based on feelings.

                  4. Two typical examples

                  Phenomenon Hypotheses are often chosen first The right way to investigate
                  Crack at the heel of the solder joint The immediate conclusion is lack of tin Check the mechanical stress in the assembly and the thermal expansion differential before concluding on the amount of tin
                  Clear boundary between ball and solder paste The immediate conclusion is a solder jointing error Compare the thermal profile and surface oxidation status to determine the correct cause
                  A sample of a molded plastic circuit board is placed next to a process diagram on the desk
                  Attaching observable traces to each step in the procedure is the step from description to traceability.

                  5. Common mistakes

                  1. Jump from photo to conclusion: Skip the data collation step because the results look too obvious.
                  2. Combine multiple causes into one conclusion: It’s generally written as “solder joint error” so no one knows what needs to be fixed.
                  3. Missing control sample: If there are no samples from the same lot, all comparisons are only relative.
                  4. Conclusion for the whole lot from one sample: a sample only represents itself.
                  5. Ignore the possibility of errors due to sample preparation: Fake scratches, burrs and gaps can be read as real defects.
                  6. Conclusion according to the requester: Choose the cause according to the ordering department’s expectations instead of according to the data.

                  6. Set of criteria to know if the conclusion is strong enough

                  • The specific failure floor has been identified, not just the general floor.
                  • There is a control sample under the same conditions.
                  • The hypothesis was verified by process data, not just by geometric inference.
                  • The possibility of error due to sample preparation was excluded.
                  • The phenomenon has been reproduced by controlled testing.
                  • Conclusions can be used to recommend specific actions for a specified step.
                  Samples and analytical instruments are stacked neatly on the laboratory table
                  A sufficiently strong conclusion must lead to a specific action at a specific stage.

                  7. Frequently asked questions

                  How long does it take to walk all five steps?

                  Depending on the complexity and availability of process data. The most time-consuming step is usually step four, because process data is not always fully saved.

                  What if there is no process data?

                  It is still possible to narrow the scope using steps three and five: construct a hypothesis over time, then reproduce it with a controlled experiment. But the conclusion will be weaker and the limits need to be clearly stated.

                  Is it always necessary to find exactly one cause?

                  No. Many errors have multiple causes and effects. It is necessary to determine which causes are the main contributors and which can be intervened.

                  Which step is most often overlooked?

                  Step one. Many investigations begin with conclusions rather than with objective descriptions, leading to data collection in a predetermined direction.

                  When should an investigation be stopped?

                  Once there is a conclusion that leads to specific corrective actions and the corrective results can be verified with subsequent data. If this has not been done, the investigation has not ended.

                  8. Conclusion

                  Cross-sectional images are the starting point of the investigation, not the results. Its real value lies in the fact that it localizes the failure layer and provides a hypothesis that is specific enough to verify with data.

                  Four things to do: separate the description step from the inference step; always have a control sample; compare process data before concluding; and only end the investigation when the phenomenon can be reproduced under controlled conditions.

                  References

                  • IPC-A-610 — Electronic Assembly Acceptance Criteria.
                  • IPC-TM-650 Method 2.1.1 — Microsectioning.
                  • J-STD-001 — Requirements for electrical soldering and electronic assembly.
                  • IPC-6012 — Technical requirements for rigid printed circuit boards.

                  Related articles


                  Discuss further


                    Disclaimer

                    This article is an interpretive content compiled by us; not legal advice. Enterprises need to compare relevant documents/standards verbatim before applying them to specific products.

                    See more: Copyright Policy & Disclaimer by ticforall.com.
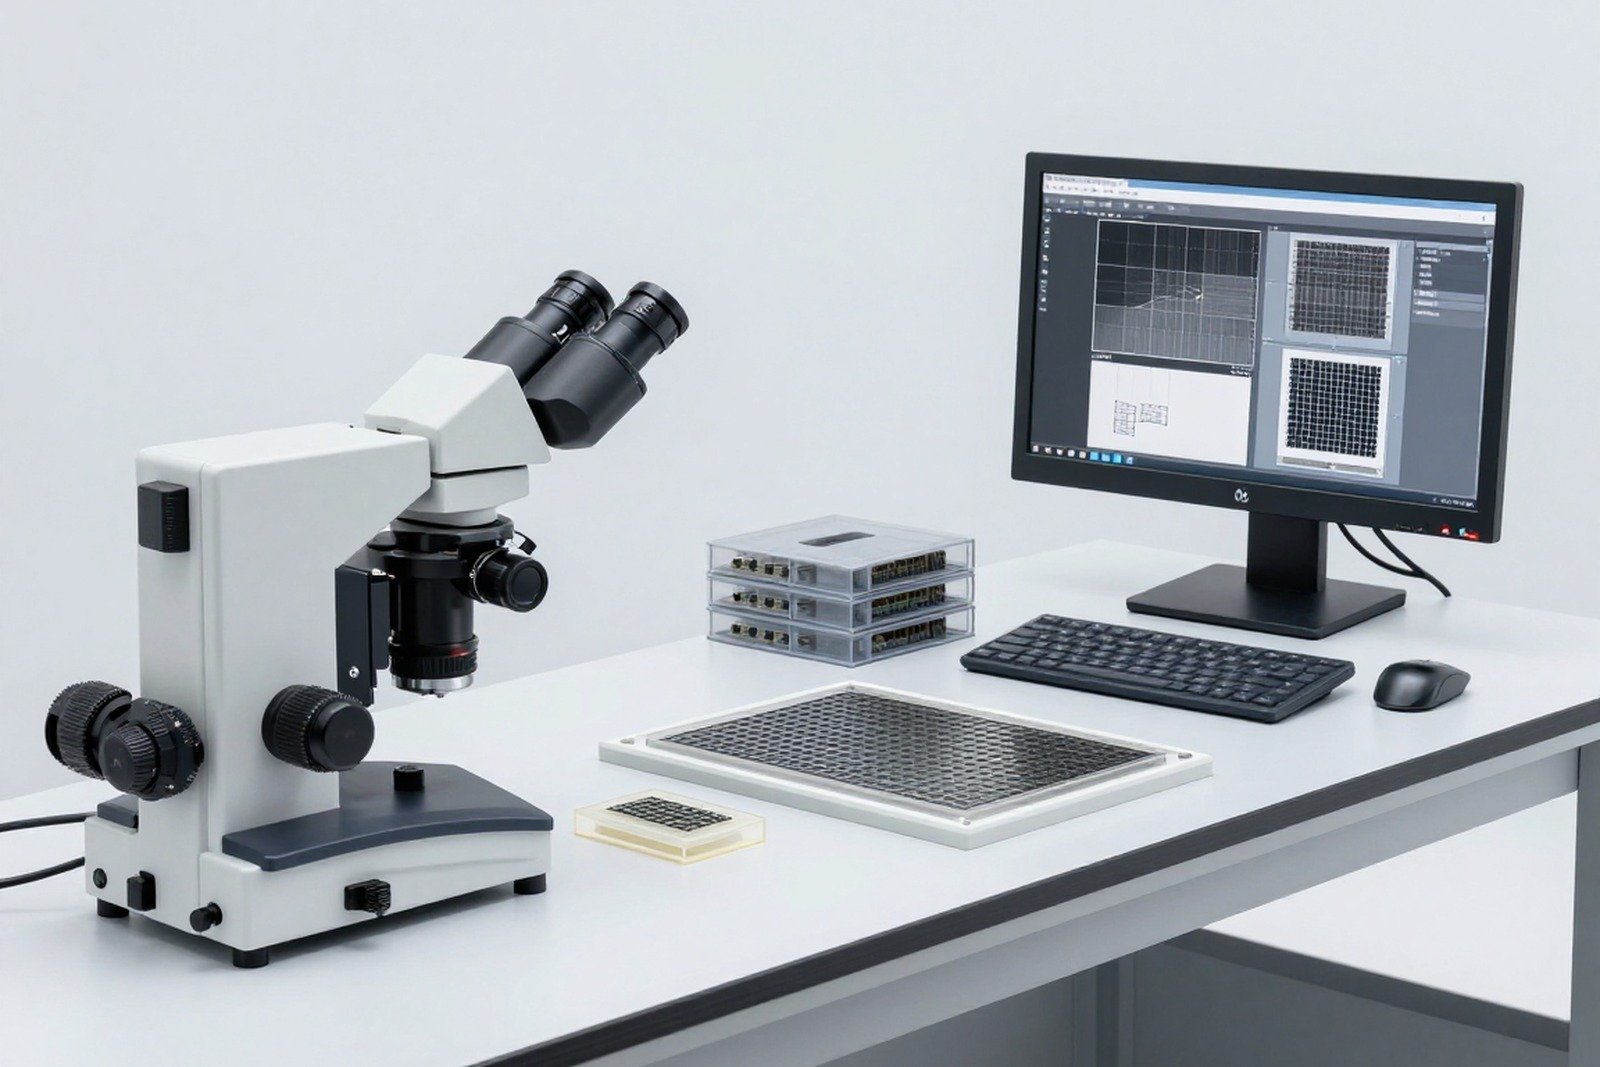
                    Peeling of coating and loss of veins: read traces on cut surface

                    0
                    Cover image of the article «Peeling of coating and loss of veins: read traces on cut surface»

                    A conformal coating exists to block moisture, dust, and impurities from the circuit board surface. But when the coating doesn’t adhere well enough, it not only loses its protective effect — it also becomes a permanent site for moisture and impurities on the surface, causing the condition to deteriorate more quickly than if left uncoated.

                    This article provides instructions on how to read peeling coating and pad peeling marks on cross-sections, how to distinguish the origin, and what control points are needed in production.

                    1. Why does the coating peel off?

                    Coating adhesion depends on three factors: whether the surface is clean, whether the surface is dry, and whether the coating has cured properly. Without any of these elements, the coating may still look normal when first applied but gradually peel off over time.

                    Cause Mechanism Marks on the cross-section
                    Surface contamination Impurities prevent the coating from coming into direct contact with the surface The coating is located a thin distance from the surface, with a strange streak in the middle
                    Moisture remains on the surface Moisture rises during solidification, creating air pockets or reducing adhesion Small bulges or gaps along the interface
                    Freezing snakes is not enough The coating is still soft and can easily be cut or pulled off the surface The coating deforms, the peeling edges stretch into fibers
                    Mechanical stress after coating Shear or tensile forces from the assembly act on the edge of the coating Flaking starts from the edge or from the edge of the component
                    Incompatible materials The coating has a different expansion rate than the base material, separating according to thermal cycles Extensive flaking, in the direction of thermal stress
                    Section of the protective coating on the board surface under a microscope
                    The cross-section shows the coating thickness and actual contact with the surface.

                    2. Types of bubbles and how to identify them

                    1. Edge peeling: The coating separates from the surface starting from the edge or from the edge of the component. This form is often due to mechanical force.
                    2. Wide area: The coating separates into large patches, often related to thermal stress or residual moisture.
                    3. Local flaking on the solder joint: The coating separates from the tin surface but remains attached to the surrounding base material, usually because the tin surface has an oxide layer or flux residue.
                    4. Air pockets under cover: closed space between the coating and the surface, not completely separated but still creating a moisture path.
                    5. Flange according to component leg area: The coating separates around the base of the component, creating a gap that conducts moisture directly to the solder joint.

                    3. Marks to be read on the cross-section

                    Traces Meaning
                    Coating thickness according to location Identify unusually thin areas, this is where the protection is weakest
                    Contact state at the interface Distinguish whether the coating is located close to the surface or away from a gap
                    The material is in the gap If there are impurities, it is evidence that the surface has not been cleaned
                    Peeling starting position Start from the edge, from the component edge, or from any other point
                    Cracks in the coating Cracking of the coating also creates moisture paths even though the coating does not peel off the surface
                    Cross-sectional image magnifying the gap between the coating and the board surface
                    A small gap between the coating and the surface is enough for moisture and impurities to enter over time.

                    4. Pad peeling and substrate material cracking

                    A related but more serious form of damage is pad shedding: the copper pad separates from the backing material, or the backing material cracks just below the pad. Two common mechanisms:

                    1. Excessive traction: When removing components, pulling wires or tightening connectors, force is transmitted to the pad and separates it from the material.
                    2. Cracking of the base material just below the pad: This form does not cause the pad to completely separate but weakens the bond, leading to an open circuit when additional thermal stress is applied.

                    On the cross-section, the second form is harder to see because the pad is still in the correct position. The telltale sign is a crack in the base material running just below the edge of the pad — which should be observed closely with high magnification.

                    5. Effects when the coating loses its effectiveness

                    Influence Mechanism Expression
                    Moisture and impurities accumulate The gap between the coating and the surface becomes the path Corrodes metal surfaces over time
                    Electrical leakage between two close points Conductive impurities in the gap create conductive paths Leakage current increases with environmental humidity
                    Electrochemical corrosion Moisture combined with voltage creates a corrosive reaction at the connection Metal corrodes, contact resistance increases
                    Reduces the mechanical strength of the solder joint Corrosive materials weaken the solder joint Cracking appears after many environmental cycles

                    6. Control points in production

                    1. Clean the surface before coating: This is the most important step and also the most overlooked.
                    2. Control residual moisture: Dry at appropriate time and temperature before coating.
                    3. Make sure it is fully frozen: Check the curing time and temperature according to the material manufacturer’s recommendations.
                    4. Avoid mechanical stress after coating: Check whether the post-coating steps accidentally impact the edge of the coating.
                    5. Periodic inspection by cross-section: Conventional adhesion tests do not detect air pockets under the coating.
                    The circuit board sample has a protective coating and the plastic molded sample is placed on the analysis table
                    Checking the cross-section in the first lot helps detect adhesion problems before they become field errors.

                    7. Frequently asked questions

                    Is peeling coating always the fault of the coating material?

                    No. The most common cause is that the surface has not been cleaned properly or is still damp before coating. It is necessary to check the procedure before changing materials.

                    Is there a way to test adhesion without cutting the sample?

                    There are surface adhesion tests, but they only evaluate the coating at the test site, not detecting air pockets or local gaps underneath. The cross-section adds that information.

                    Are air pockets under the cover always at fault?

                    Not immediately. But it is a potential moisture conduit, and in highly humid or contaminated environments, it becomes a corrosion initiation point.

                    Can a bong pad be detected by normal testing?

                    Only when the pad has separated is visible. In cases where cracks in the substrate material under the pad are often not apparent, a cross-section or resistance test must be used.

                    Where should I focus on cutting?

                    You should choose areas with many pin components, the interface between the coating and the component pin, and the area near the connector — places that are most exposed to mechanical and moisture impacts.

                    8. Conclusion

                    The coating is only effective when it truly adheres to the entire surface. A small gap is enough to turn the protective layer into a permanent moisture trap, and the consequences appear late in the form of corrosion and electrical leakage.

                    Four things to do: control cleaning and drying before coating; Check the cross-section in the first batch to see air pockets and gaps; clearly state the location of the start of peeling to deduce the stress source; and incorporate environmental testing to assess actual effects over time.

                    References

                    • IPC-A-610 — Acceptance criteria of electronic assemblies, protective coating section.
                    • IPC-CC-830 — Standard for protective coating materials for printed circuit boards.
                    • IPC-TM-650 Method 2.1.1 — Microsectioning.
                    • J-STD-001 — Requirements for electrical soldering and electronic assembly.

                    Related articles


                    Discuss further


                      Disclaimer

                      This article is an interpretive content compiled by us; not legal advice. Enterprises need to compare relevant documents/standards verbatim before applying them to specific products.

                      See more: Copyright Policy & Disclaimer by ticforall.com.